Clean Power Plan implementation decisions affect CO2 emissions and electricity prices
The U.S. Environmental Protection Agency's (EPA) Clean Power Plan (CPP) regulates carbon dioxide (CO2) emissions at existing fossil-fueled electric power plants, but the ultimate energy-related emissions effect depends to an important extent on how the rule will be implemented by states. Because the CPP provides the flexibility to choose different compliance options for reducing CO2 emissions, EIA has produced an Issues in Focus analysis that considers several compliance paths.
One of the most significant options is the compliance metric itself. States may choose between mass-based standards, which impose an absolute cap on the amount of CO2 allowances, or rate-based standards, which limit the amount of CO2 per unit of electricity generated. Each state's choice may have implications for other states, as the CPP provides the flexibility for states choosing the same compliance option to cooperate. For example, for two states complying with mass-based standards, a state with relatively low compliance costs could reduce CO2 emissions below its target level and sell the excess allowances to another state with comparatively high compliance costs.
Instead of modeling each state individually, EIA's analysis considers 22 electricity market regions, which reflect electricity markets better than state borders.
In terms of CPP compliance, the AEO2016 Reference case assumes that the CPP is implemented according to schedule and that states comply with a mass-based standard.
The CPP Rate case assumes all regions choose rate-based standards instead of mass-based standards.
The CPP Interregional Trading case uses mass-based standards as in the Reference case but allows allowance trading within the Eastern Interconnection and within the Western Interconnection, the two largest interconnections of the North American electric grid, covering essentially all of the United States except much of Texas.
The CPP Allocation to Generators case assumes that the mass-based allowances are allocated to the generators that produce the power instead of to load-serving entities that sell the power to the end-use customers. The Reference case assumes that the allowances are allocated to the load-serving entities, and these revenues provide a rebate on consumers' bills. Allowances allocated to generators may result in the cost of the allowance flowing through to consumer prices.
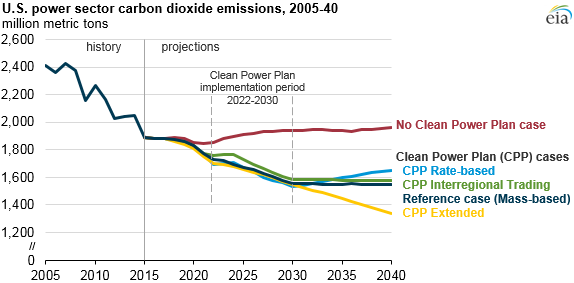
The CPP Extended case further reduces mass-based targets after 2030 instead of maintaining a constant level as specified in the CPP. In this case, power-sector CO2 emissions are required to be 45% below 2005 levels in 2040, compared to 35% in 2030.
The No CPP case assumes the CPP, which is currently on hold pending judicial review, is permanently voided.
In general, power-sector CO2 emissions are highest in the No CPP case and lowest in the CPP Extended case, at 19% and 45% below 2005 emissions levels in 2040, respectively. From an emissions savings perspective, all other scenarios are similar to the Reference case through 2030, where power-sector CO2 emissions are about 35% below 2005 levels. In the CPP rate case, CO2 emissions begin to rise after 2030 as both electricity generation and resulting emissions increase. In the CPP Interregional Trading case, CO2 emissions are slightly higher than in the Reference case as a few regions have more stringent existing programs resulting in excess CPP allowances that can be sold to other markets.
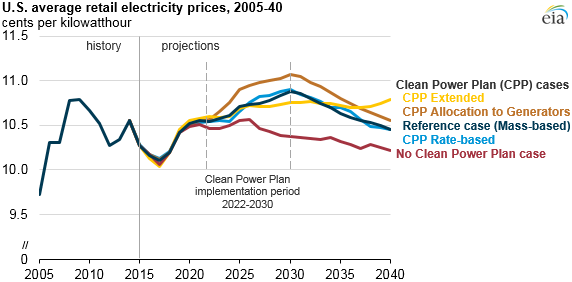
Because the compliance paths have implications for compliance costs, the various CPP cases result in slightly different retail electricity prices. EIA projects higher retail electricity prices in the CPP cases primarily because of increases in fuel costs associated with shifting to natural gas-fired generation and capital costs associated with renewable capacity additions. Price effects are similar in the Reference and CPP rate cases where the average electricity price from 2022 through 2030 in both cases is 2% higher than in the No CPP case, and 3% higher on average from 2030 through 2040.
In the CPP Extended case, further reductions in CO2 emissions after 2030 beyond the levels specified by the CPP require more renewable and natural gas-fired generation. The resulting electricity price in this case in 2040 is 3% higher than in the Reference case and 6% higher than in the No CPP case. In the CPP Allocation to Generators case, the allowances are distributed to generators instead of to load-serving entities and the cost of allowances is included in marginal production costs instead of rebated to consumers. As a result, the average electricity price from 2022 through 2040 in the CPP Allocation to Generators case is 1% higher than in the Reference case and 4% higher than in the No CPP case.
More analysis about the Clean Power Plan and detailed results for all of the CPP cases are included in the Annual Energy Outlook 2016 Issues in Focus article.
Principal contributor: Jeff Jones