Lower crude feedstock costs contribute to North American refinery profitability
*Note: 2014 includes data for the first quarter of 2014.
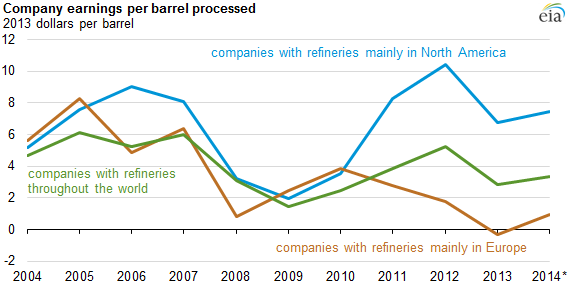
First-quarter 2014 financial results continued a three-year trend of North American refineries showing considerably higher profitability than European refineries as measured by earnings per barrel processed. While many factors contribute to refinery profitability, lower North American crude oil prices compared with world prices have been a key factor driving this outcome. North American refiners' earnings per barrel processed were more than $6 per barrel (bbl) higher than their European competitors for the first three months of 2014, based on an analysis of 26 energy companies with refinery operations that submit financial and operating information by segment to the U.S. Securities and Exchange Commission (SEC).
These SEC financial data allow for analysis of the entire refining sector by comparing just the refining business of global integrated companies (that explore and drill for oil as well as refine it) with those that only refine crude oil into products. Earnings per barrel processed takes a company's earnings from its refining and marketing segment and divides it by its refinery runs, which is a useful measure for comparing large companies with smaller ones.
In this analysis, EIA compared 13 companies based in North America and 13 in Europe. Ten of these companies have nearly all their refinery throughput in North America, 10 others have nearly all their throughput in Europe, and 6 have refineries throughout the world. Total earnings in the refining segment for each grouping was divided by its total refinery runs to estimate earnings per barrel processed (see chart). The scale of refinery runs varied widely across the companies in the sample selected, with 59,000 barrels per day (bbl/d) being the smallest and 4.6 million bbl/d being the largest in 2013. Earnings in the refining segment ranged from a loss of almost $2 billion for one company to a profit of $4.3 billion for another. Total refinery throughput for these companies averaged 25.6 million bbl/d in 2013, approximately 56% of total liquid fuels consumption by the countries of the Organization for Economic Cooperation and Development (OECD).
Since 2013, Gulf Coast refiners began to see increased earnings because of lower crude costs after some of the infrastructure bottlenecks to flow crude oil to the Gulf Coast were removed and prices of Light Louisiana Sweet (LLS) crude began to trade at a discount to Brent. Product prices in North America, however, continued to be driven by international crude oil prices and petroleum product markets. Crack spreads, the difference between the purchase price of crude oil and the wholesale selling price of refined products, on the Gulf Coast increased in late 2013, and have remained high in 2014.
In 2014, U.S. crude prices remain discounted to Brent. Additionally, relatively cheaper natural gas prices in North America continue to provide U.S. and Canadian refineries with further energy feedstock price advantages compared with refineries in other parts of the world.
Principal contributor: Jeff Barron
Tags: Brent, crack spread, Europe, financial markets, liquid fuels, oil/petroleum, prices, refining