Personal travel growth significantly influences projected transportation energy demand
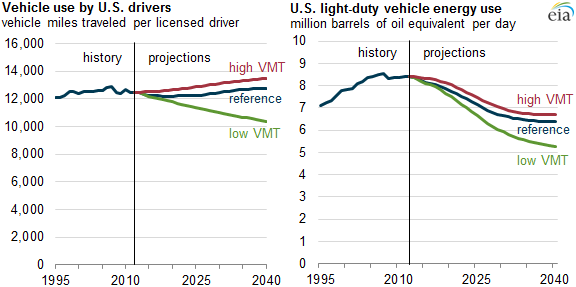
Personal travel, measured in light-duty vehicle miles traveled (VMT) per licensed driver, reached 12,900 miles per year in 2007 and decreased to about 12,500 in 2012. This shift in travel behavior is important because it directly influences light-duty vehicle (LDV) energy demand for transportation fuels such as gasoline and diesel. Recent analysis suggests that multiple factors influence travel behavior. These include economic, demographic, technological, social, and environmental determinants that have the potential to significantly shift light-duty vehicle energy consumption.
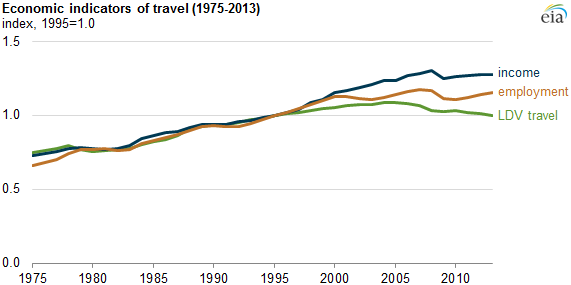
Economic factors. Although economic indicators such as employment, income, and economic growth remain a dominant influence on levels of personal travel, U.S. travel indicators started to decouple from income and employment after 2007. Declines in the labor participation rate (the percentage of the total population ages 16 years and older either employed or looking for work) since the early 2000s, as well as income, fuel prices, the costs of purchasing a vehicle, and other operating costs all continue to affect LDV travel demand.
Demographic factors. Population, age distribution, and licensing rates are important additional determinants of LDV travel demand. Licensing rates specific to gender and age groups and their associated travel behavior will affect VMT, particularly for the most influential age groups. Licensing rates for the youngest portion of the U.S. population have declined steadily since 1990 as fewer individuals obtain a driver's license or as individuals delay obtaining a license until later in life. In addition, as the population ages, individuals tend to drive less. The percentage of the U.S. population aged 65 and older is expected to increase from 17.4% in 2012 to 26.8% in 2040.
Other factors. Technological, social, and environmental factors also influence VMT. Increasing fuel efficiency of LDVs, telecommuting, e-commerce, urbanization, alternative modes of travel (mass transit, rail, car-sharing, car-pooling, biking, pedestrian travel), and social media can supplant or complement personal vehicle use.
The Annual Energy Outlook 2014 considers two scenarios that examine variations in travel demand as compared with the Reference case. The Low VMT case assumes an environment in which travel choices made by drivers result in lower demand. VMT per licensed driver and total VMT are 19% lower in 2040 than the Reference case. U.S. transportation sector energy demand reaches 5.3 million barrels of oil equivalent in 2040, 18% lower than the Reference case, while total carbon dioxide emissions from the transportation sector are about 9% lower than the Reference case.
The High VMT case assumes changes in travel behavior that result in a moderate increase in VMT per licensed driver relative to the Reference case. VMT per licensed driver and total VMT are 6% higher in 2040 than the Reference case. U.S. LDVs will consume 6.7 million barrels per day of oil equivalent in 2040, or 5% more than in the Reference case, while total carbon dioxide emissions exceed the Reference case by 2.5%.
More detailed analysis of VMT trends and their implications for transportation energy consumption can be found in the AEO2014 Issues in Focus article on this topic.
Principal contributor: Patricia Hutchins