Natural gas prices reflect decreasing seasonality
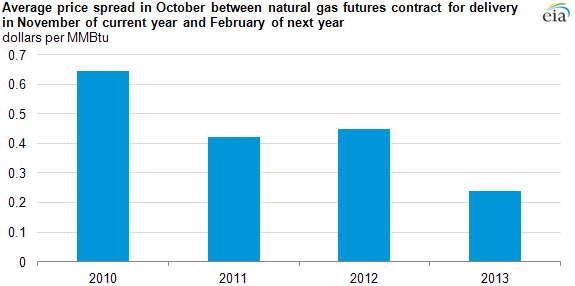
Note: The numbers above represent the average price spread during October trading between the Henry Hub futures contract for delivery in November of the same year and February of the next year on the New York Mercantile Exchange (e.g., the 2010 bar is the February 2011 contract price minus the November 2010 contract price during October 2010 trading). The November contract represents an average non-peak autumn month, and the February contract represents a peak winter month.
North American natural gas markets exhibit seasonal variation, with higher prices in winter because of increased heating demand. This seasonality of prices can be seen in natural gas futures contracts traded on the New York Mercantile Exchange (Nymex).
Over the past four years, the spread between the natural gas price for delivery in February and for delivery in November has decreased from an average of 65 cents per million British thermal units (MMBtu) in October 2010 trading to an average of 24 cents in October 2013. The price spread represents the market's expectations of prices in the peak winter month, compared with prices in an autumn month, with a lower spread indicating less expected seasonal variation.
Several factors contributed to the reduction in seasonality in natural gas markets:
- Increased natural gas production, particularly in consuming regions like the Northeast, has put less strain on the amount of supply needed to be withdrawn from storage. Net withdrawals from inventory decreased during the winter of 2012-13 compared to the winter of 2010-11, despite higher levels of consumption and lower net imports.
- Gas displacement of coal for electricity generation has reduced seasonality of power sector gas use. However, when natural gas markets tighten, coal-fired power plants become more economically competitive than some natural gas-fired plants, releasing gas to other customers.
- Consumption in November through February as a share of yearly natural gas consumption has decreased from 41% in 2010-11 to 39% in 2012-13, demonstrating that natural gas consumption is increasing in other months of the year for other uses, such as electricity generation during the summer.
- Natural gas storage working capacity increased 2% in 2012.
The declining price spread suggests that market participants expect less seasonal variability in natural gas prices compared to previous years; however, the eventual price will often be determined more by supply and demand when the physical natural gas is sold. Regardless of what short-term factors affect the natural gas price, long-term trends continue to reduce the seasonality of natural gas markets. The market for future year contracts currently reflects lower seasonal variability than in the past.
Principal contributor: Jeff Barron
Tags: futures, natural gas, prices