Highlights of new Drilling Productivity Report
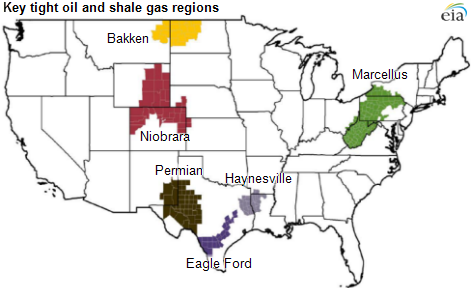
EIA's new Drilling Productivity Report (DPR) takes a fresh look at oil and natural gas production, starting with an assessment of how and where drilling for hydrocarbons is taking place (see map). The first edition of the DPR was released today.
As mentioned in yesterday's Today in Energy story, new technologies for drilling and producing natural gas and oil have made traditional measures of productivity, such as a simple count of active rotary drilling rigs, obsolete. With more than half of newly-drilled wells now producing both oil and natural gas, it is also no longer sufficient to categorize rigs as either oil-directed or gas-directed.
Like traditional measures, the DPR makes use of recent rig activity data, but also explicitly considers recent information on wells drilled per active rig (rig productivity), average oil and natural gas production rates from new wells during their first full month of operation, and estimated changes in production from existing wells to develop estimates of overall changes in production for each region. EIA's approach in the DPR does not distinguish between oil-directed and gas-directed rigs—it counts all active rigs—because once a well is completed, it may produce both oil and gas. Because production data reported by states can be significantly lagged, DPR uses the rig count data along with trends in drilling productivity to make estimates of oil and gas production where data are not yet available.
At present, the DPR focuses on six active regions, which together accounted for 90% of domestic oil production growth and virtually all domestic natural gas production growth in 2011-12.
The DPR provides a page summarizing results for all six regions, a more detailed page for each region, and a detailed description of the indicators developed and presented for each region. Some of the main findings of the DPR include:
- Increases in drilling efficiency and new well productivity, rather than an increase in the number of active rigs, have been the main drivers of recent growth in domestic oil and natural gas production.
- The Bakken and Eagle Ford regions together account for about 75% of current monthly oil production growth across the six regions tracked in the DPR. Over the past year, production in these two regions increased by nearly 700,000 barrels per day. The Permian region, which remains the biggest absolute oil producer, grew by about 93,000 barrels per day from last year's production level.
- Although natural gas production increased in four of the six DPR regions over the past year, the Marcellus alone accounted for about 75% of natural gas production growth in the six regions.
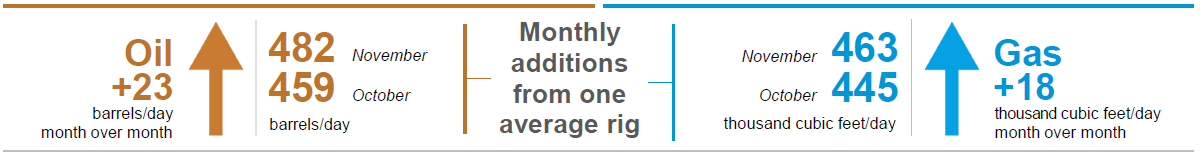
A description of the information on the detailed DPR page for each region is provided below (using the October 2013 Bakken page as an example).
Note: Click to enlarge.
The left chart at the top of each DPR regional page provides estimates of how much oil was or is expected to be produced from new wells per average rig in the region for the current and following months, as well as the month-over-month change. This estimate is an indicator of rig productivity that encompasses both the time it takes to drill a new well and the productivity of that well. The right chart at the top of each DPR regional page presents corresponding rig productivity estimates for natural gas.
Note: Click to enlarge.
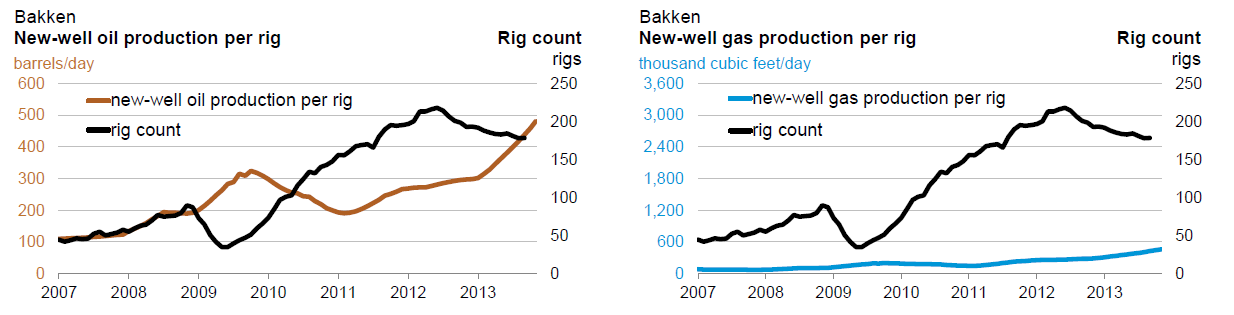
The second row of each DPR regional page presents two graphics, one each for oil and natural gas, showing the total rig count (same in both graphs) and new well production per rig from the start of 2007 through the estimates for the current and following month.
Note: Click to enlarge.
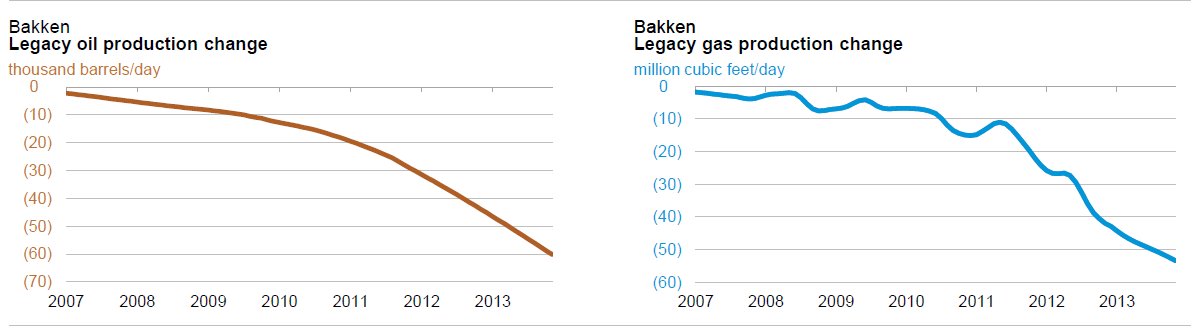
The third row of each DPR regional page presents two graphics, one each for oil and natural gas, providing data on regional monthly change in production from legacy wells, defined as all wells other than those that have not yet completed their first full month of production, from the start of 2007 through the latest available estimates. This measure is generally negative, as aging wells typically produce less oil and natural gas over time.
Note: Click to enlarge.
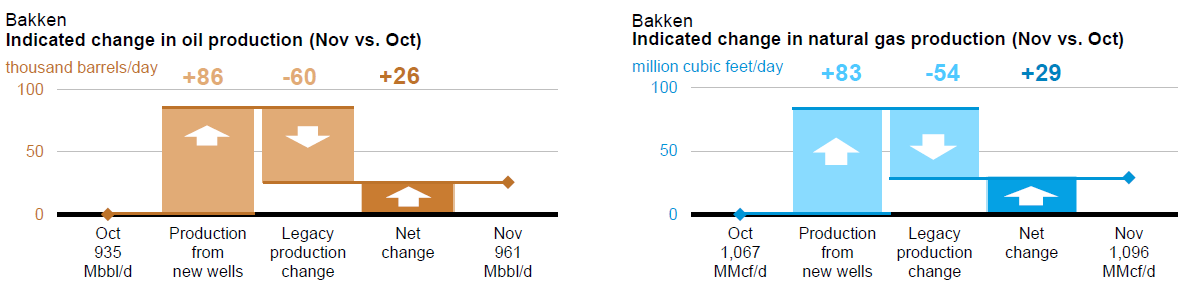
The fourth row of each DPR regional page presents two graphics, one each for oil and natural gas, summarizing the estimated month-over-month net change in aggregate regional production from the current month to the following month, taking account of both new and legacy well production.
Note: Click to enlarge.
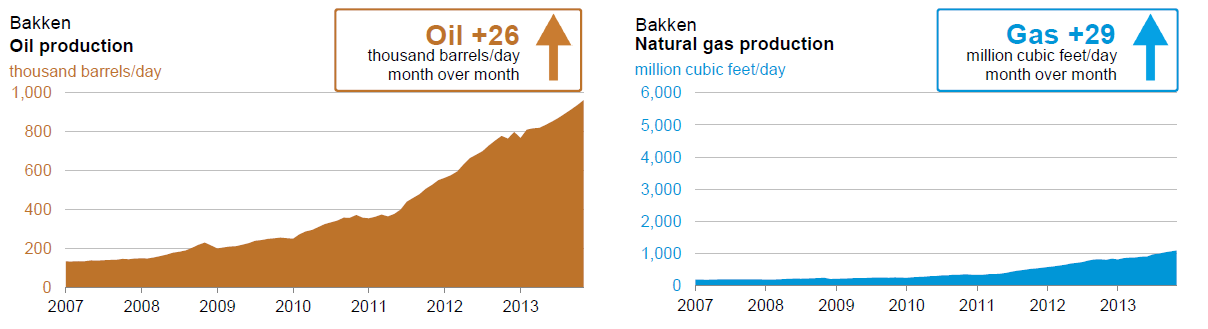
The bottom row of each DPR regional page presents two graphics, one each for oil and natural gas, showing total monthly production within the region from the start of 2007 through the estimates for the current and following month. Production reflects all wells reported to state oil and gas agencies or EIA estimates in cases where state data are not immediately available.
Future Today In Energy articles will discuss the individual metrics included in the DPR in further detail and explain their relationship to traditional measures. Additional articles will periodically report on significant changes in DPR data and estimates as warranted.
Principal contributor: Jozef Lieskovsky, Sam Gorgen