Coal market fundamentals changed, yet spot prices remained stable
Note: Data are through June 2013.
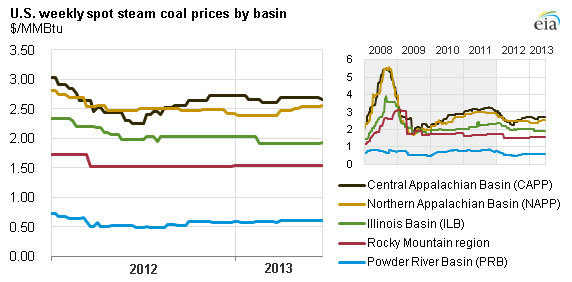
While coal market fundamentals changed in first-half 2013 compared with the same period of 2012, spot prices remained largely unchanged. Demand for coal was higher and supply was lower in first-half 2013, but because electric companies chose to burn off large inventories instead of buying more coal and because international coal prices were weaker, the spot market remained largely unchanged.
Coal demand increased. The continued rise in natural gas prices drove more use of coal for electricity generation. This, combined with higher electricity demand, resulted in total coal consumption for electricity generation in all sectors of 31 million tons, or 13%, more in the first four months of 2013 than in the same period of 2012. Although data for the second quarter of 2013 are not yet available, the increase in domestic consumption for the first half of 2013 is likely to more than offset the weaker coal exports anticipated in the second quarter of 2013, resulting in higher year-on-year total coal demand.
Coal supply decreased. Total coal production in the first half of 2013 was 21 million tons, or 4%, lower than in the same period of 2012, according to Mine Safety and Health Administration (MSHA) data through the first quarter of 2013 coupled with EIA estimates for second-quarter 2013. Coal imports dropped 0.5 million tons year-on-year in the first four months of 2013 and are likely to remain largely unchanged year-on-year for the first half of 2013. As a result, overall supply of coal was less than in 2012.
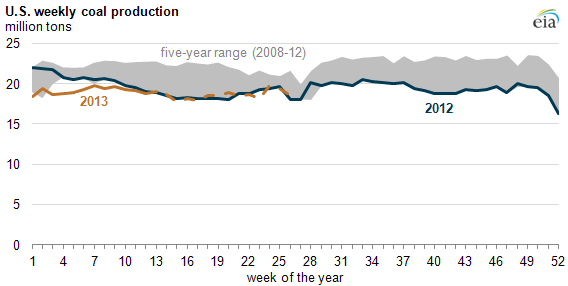
Note: Data for January 2008 through March 2013 are revised to match the MSHA data. Data for April 2013 through June 2013 are preliminary EIA estimates.
Coal inventories dropped. Inventories in the electric power sector dropped below the monthly five-year average in April 2013 for the first time since December 2011. The significant overhang of coal stockpiles at power plants in the electric power sector seen in the first half of 2012 was largely reduced in first-half 2013. Coal inventories at power plants have been steadily declining from January to April and shed a total of 28 million tons by the end of April 2013 compared with the year before. The drawdown of subbituminous coal (mostly Powder River Basin, or PRB, coal) of 18 million tons, or 18%, was greater than the drawdown of bituminous coal of 10 million tons, or 11%.
Although the changes in supply-demand balance suggested that prices should rise, this did not happen. Increased demand was largely met through inventory withdrawals rather than through increased purchases from coal producers. That, plus lower international coal prices, put downward pressure on domestic coal prices.
Changes in fundamentals vary among coal supply regions. While the supply-demand balance tightened for coal in general, changes in consumption and production of coal from different mining regions varied. The rise of first-half-year average natural gas prices at Henry Hub to $3.76/MMBtu in 2013 is likely to have resulted in overall stronger growth of consumption of the lower-cost PRB and Illinois Basin (ILB) coals. Although Appalachian and PRB coal production all declined in response to lower demand for deliveries, Central Appalachian (CAPP) coal production was cut deeper than all other mining regions—10.3 million tons, or 13%, compared with the first half of 2012. Steadily declining domestic demand for steam coal from CAPP and weaker exports of metallurgical coal compared with the year before forced producers to close higher-cost mines. In contrast, ILB coal production increased year-on-year as the coal expanded its market both domestically and overseas. Higher gas prices and the lower cost of ILB coal relative to Appalachian coals supported more use of ILB coal for power generation in the domestic market. Geographic proximity to coal-exporting infrastructures also enabled the coal to benefit from international demand.
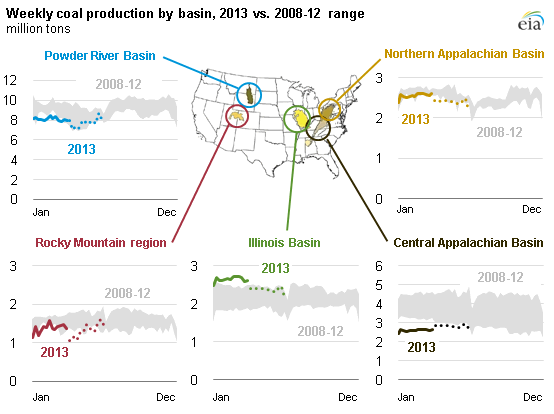
Note: Data for January 2008 through March 2013 are revised to match the MSHA data. Data for April 2013 through June 2013 are preliminary EIA estimates.