Gulf Coast crude stocks generally fall sharply in December because of inventory taxes
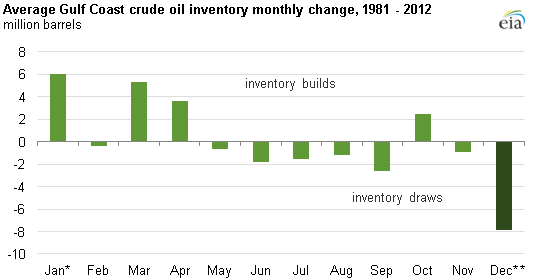
Notes: *January data are for 1982 - 2012. **December data are for 1981 - 2011.
Crude oil inventories in the Gulf Coast often fall sharply in December, averaging a decline of nearly 8 million barrels in that month from 1981 through 2011. Preliminary data for December 2012 show a decline of more than 12.5 million barrels in the region, bringing end-of-year crude inventories to approximately 165 million barrels. The reason for this sharp decline: December 31 is the typical assessment date for taxes on crude oil stocks that are collected by many states/counties/municipalities in regions where the bulk of U.S. crude oil and petroleum product inventories are stored. To decrease crude inventories, companies can do a combination of the following: delay or decrease imports, increase runs at refineries, move crude oil out of the taxable region, or sell crude oil to other market participants.
Following December declines, inventories tend to recover in January. Although large crude oil draws can be an indication of demand outpacing supply, the December phenomenon typically does not reflect tightening of the oil market, but rather how companies in the region are taxed on crude stocks. During the middle of the year, crude inventories in the Gulf Coast region both rise and fall, averaging out to relatively small net changes in stocks for a given month.
At the end of December each year, parts of Texas and Louisiana, where significant volumes of crude oil are stored, assess ad valorem taxes (meaning, according to value) on end-of-year crude oil inventories. These taxes, along with the generally accepted accounting practice of last-in, first-out (LIFO) method used to value the assets, create an incentive to draw down crude stocks in the region at the end of the year in order to reduce the tax bill. If oil prices have risen during the year, this accounting practice gives companies stronger incentive to reduce inventory because doing so will further limit their tax exposure. Conversely, if oil prices have fallen throughout the year, companies have less incentive to reduce crude held in storage.
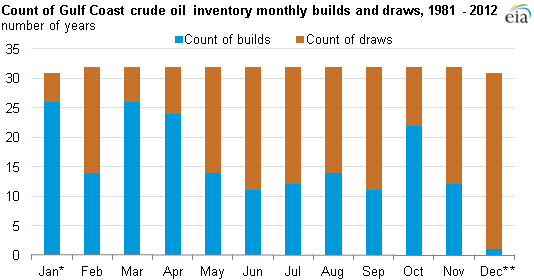
Notes: *January data are for 1982 - 2012. **December data are for 1981 - 2011.
Since January 1981 (when EIA began publishing regional crude stocks data), Gulf Coast crude inventories have fallen by more than 10 million barrels within a single month 24 times. Ten of these instances were in December; no other month accounts for more than three occurrences. Although large crude oil draws are often an indication of demand outpacing supply, market participants are familiar with this December trend and understand that it does not reflect a tightening of the oil market. Gulf Coast crude inventories fell 30 times in December since 1981, compared with only one instance of a December increase in stocks (see chart). Conversely, Gulf Coast crude inventories rise in most years during January. During the middle months of the year, Gulf Coast crude inventories appear to increase and decrease with equal frequency.