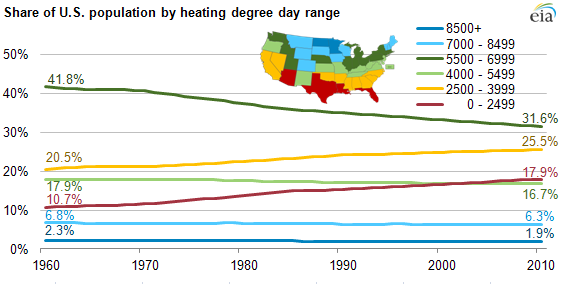
Population shifts across U.S. regions affect overall heating and cooling needs
Source: EIA, based on the National Oceanic and Atmospheric Administration and Census Bureau.
Since the nation's founding, the population of the United States has migrated westward. The advent of air conditioning nearly a century ago contributed to population shifts to southern tier states as well, especially in the second half of the 20th century. This regional shifting of the population affected the need for heating and cooling. A common measure used for analyzing the relationship between temperatures and energy consumption is the degree day.
In 1960, 31.2% of the U.S. population lived in the warmest states, where annual heating degree days (HDD) averaged less than 4,000, as indicated by the red and yellow lines in the figure. By 2010, this share of the population rose to 43.4%. In contrast, the share of the population living in cooler states, with HDD ranging from 4,000 to 6,999, declined from 59.7% of the population in 1960 to 48.3% in 2010, as indicated by the two green lines in the figure. The share of the U.S. population living in the coldest regions, where HDD average more than 7,000, has also declined slightly from 9.1% in 1960 to 8.2% in 2010, as shown by the two blue lines in the figure.
The National Oceanic and Atmospheric Administration (NOAA) estimates degree days for 344 climate divisions based on observed temperatures from representative weather stations within each division. NOAA calculates average heating degree days and cooling degree days for states, Census Bureau regions, and the contiguous United States by weighting with climate division populations. These populations are reset after each decennial census, and NOAA recalculates historical degree days based on the most recent population weights (currently using the 2000 Census).
In order to more accurately reflect how regional shifts in the U.S. population affect weather-related energy consumption, the forecasting models used for EIA's Short-Term Energy Outlook and Annual Energy Outlook calculate degree days based on dynamic population weights instead of a static benchmark year for population weighting.
Observed winter temperatures have become milder over the past few decades. Estimates of average U.S. heating degree days based on static 2000 Census populations have declined an average of about 0.2% per year between 1960 and 2010.
If heating degree days are dynamically weighted by each state's annual population, instead of the population for a fixed year, U.S. heating degree days show an average annual decline of 0.4% between 1960 and 2010. This shift in the population toward warmer climates partially explains some of the flattening in per-capita residential energy consumption over the past few decades. Space heating accounts for more energy consumption than space cooling, and the decreased need for space heating as a result of population shifts to warmer areas of the country is only partially offset by increased energy consumed for space cooling.
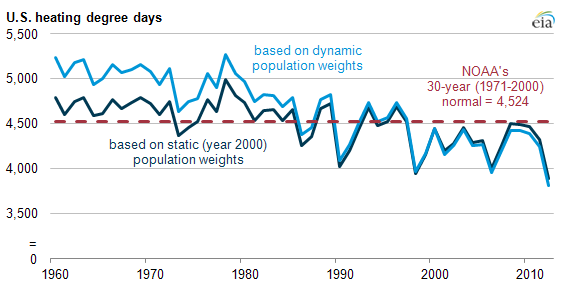
Note: The static line reflects heating degree days (HDD) weighted by fixed state-level populations from the 2000 Census. The dynamic line reflects HDD weighted by state populations for each individual year. HDD for 2012 include published historical data through September 2012 and NOAA projections for the remaining months.