EIA improves state-level monthly oil production estimates with up to 10 years of revisions
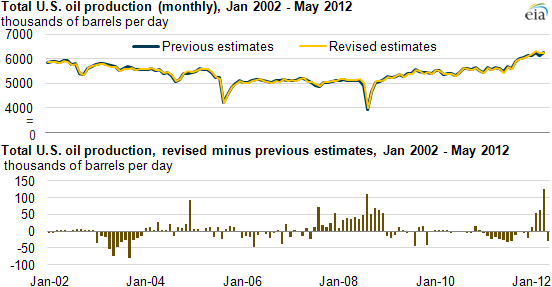
With the release of the 2011 Petroleum Supply Annual (PSA), the U.S. Energy Information Administration (EIA) revised State-level monthly crude oil (including lease condensate) production estimates going back to January 2002. Changes for total U.S. production do not exceed 2% (112,000 barrels per day, or bbl/d) for any given month.
Some of the smaller-volume producing states, however, such as Mississippi, show significant changes (see tab for Mississippi). Revisions for Mississippi exceed 5% of the previous estimate for 53 out of the 125 months of estimated production from January 2002 to May 2012. Many of EIA's data sources for state-level oil production, such as the Mississippi State Oil and Gas Board, frequently revise historical estimates. These revisions are now more regularly updated in EIA's published estimates.
Before 2012, monthly oil production estimates in the PSA and EIA databases were revised for the previous year, once a year. Starting with the release of the March 2012 Petroleum Supply Monthly (PSM), revised state-level estimates from January 2010 to December 2011 were reported in the Petroleum Navigator. Going forward, with the annual release of the PSA, EIA will revise up to 10 years of historical production estimates, in addition to the two years of estimates revised once a month with the release of each PSM.
EIA changed its revision policy to provide more accurate state-level information about historical oil production. EIA relies on state production reports in preparing its oil production estimates. Because the state data sources have varying reporting frequency, purposes, statistical methods, and quality, EIA frequently revises estimates as more complete historical data become available. For example, the time-lag for relatively complete reporting of state production for some of the largest oil-producing states varies from two months (Alaska and North Dakota) to two years (Texas and Oklahoma). Several states, such as Colorado and Wyoming, have short lags in reporting production data (three months), but on occasion revise monthly production estimates going back as far as 10 years.
Revisions for the largest producing individual states and Federal offshore areas (areas producing more than 500,000 bbl/d over the January 2002 - May 2012 period) vary from essentially no revisions (North Dakota and Alaska) to revisions up to 4% for particular months for Texas and the Federal Gulf of Mexico (see tabs for Texas and Federal Gulf). States producing smaller volumes, in the range of 50,000 to 200,000 bbl/d, do not have revisions exceeding 2% for most months, with a couple of notable exceptions. Colorado and Mississippi, each with increasing production trends, had significant upward revisions of historical production (see tabs for Colorado and Mississippi). The larger revisions reflect that historic EIA data were not revised after publication of each PSA or PSM in the past, despite revisions made by state reporting agencies. EIA's new revision policy will provide up-to-date production history in the future.
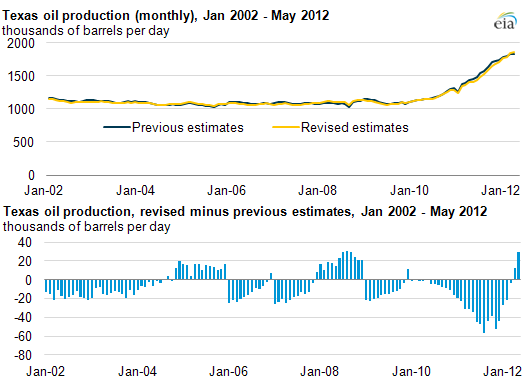
Oil production in Texas is currently more than 1.9 million bbl/d, roughly 30% of U.S. total production, and more than any other state or Federal offshore region. Revisions of production estimates for most months (116) were 2% or less. Nine months of production were revised by 3% or 4%. The steep increase in oil production from 2009 through July 2012 is largely the result of increased production from the Eagle Ford Shale and Permian Basin.
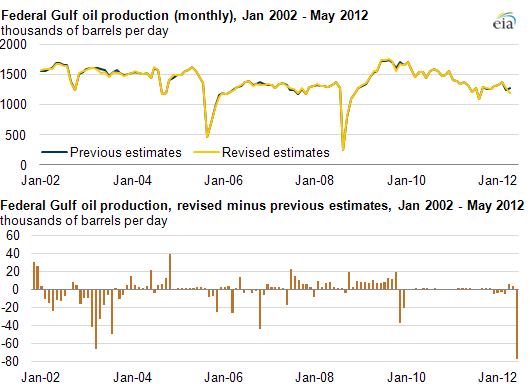
The Federal Gulf of Mexico currently produces more than 1.2 million bbl/d, second only to Texas. Changes in Federal Gulf of Mexico oil production estimates were not more than 2% or less for 119 of the 125 months. Six months of estimates were revised by 3% to 4%. One month, May 2012, was revised by 6%.
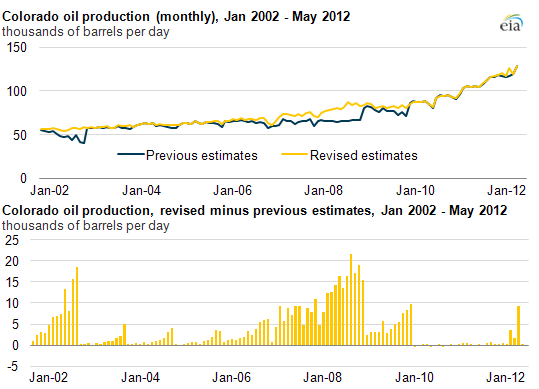
Colorado produces more than 100,000 bbl/d, roughly 2% of total U.S. production. Colorado's oil production has been increasing for the past decade, with a marked increase in the production rate over the past two years. Production increased by 40,000 bbl/d from May 2011 to May 2012. Revisions for Colorado production estimates exceeded 10% for 33 months, with 11 months exceeding 20% and 4 months with more than a 30% change. These larger revisions reflect that the Colorado Oil and Gas Conservation Commission updated monthly production (as reporting from operators became more complete) after EIA published its estimates. EIA revised recent estimates going back to January 2010, starting with the March 2012 PSM, which explains why the substantial revisions shown on the chart are for the months before January 2010. EIA's new revision policy will provide more accurate historical production for Colorado and other states in the future.
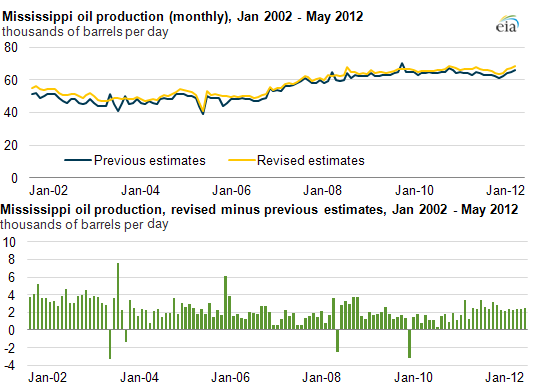
Mississippi produces more than 65,000 bbl/d of oil, roughly 1% of total U.S. production. Revisions for Mississippi exceed 5% for 48 out of the 125 months of estimated production. The Mississippi State Oil and Gas Board frequently revises historical estimates, and these changes are now more regularly updated in EIA's published estimates.
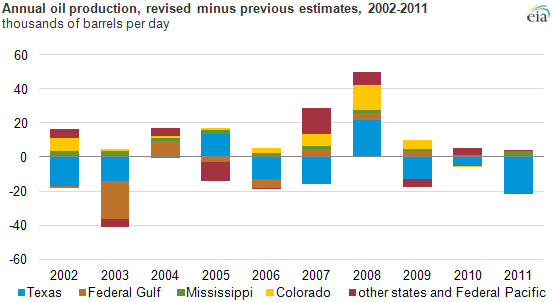
Since 2002, annual revisions for crude oil and condensate together have ranged between 50,000 bbl/d for upward revisions and 40,000 bbl/d for downward revisions (see chart above). The biggest changes during this period were the downward and upward revisions estimated for Texas for most years, and downward revisions for the Federal Gulf in 2003. Net annual revisions reached 50,000 bbl/d in 2008, and 36,000 bbl/d in 2003, but did not exceed 20,000 bbl/d for the remaining years.