EIA adds new play production data to shale gas and tight oil reports
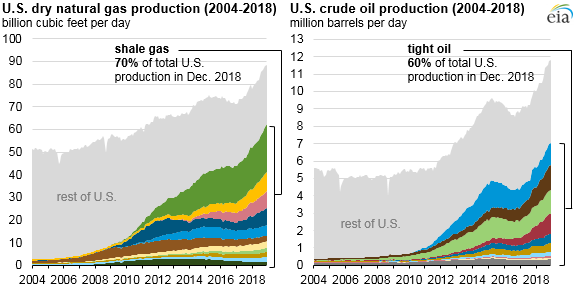
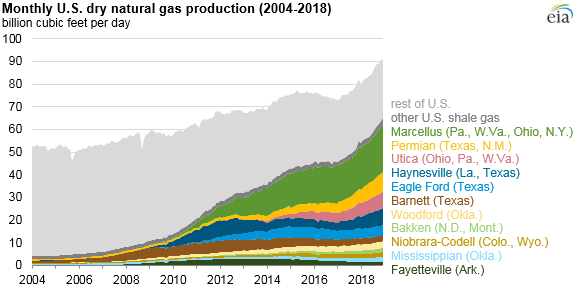
In December 2018, U.S. shale and tight plays produced about 65 billion cubic feet per day (Bcf/d) of natural gas (70% of total U.S. dry gas production) and about 7 million barrels per day (b/d) of crude oil (60% of total U.S. oil production). A decade ago, in December 2008, shale gas and tight oil accounted for 16% of total U.S. gas production and about 12% of U.S. total crude oil production.
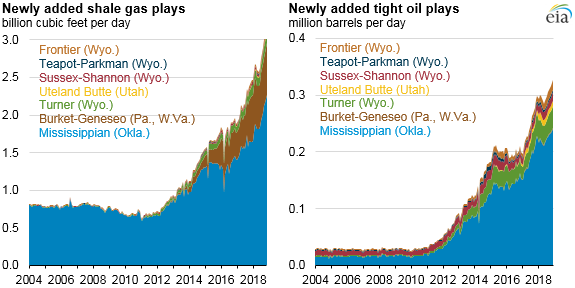
EIA recently updated its methodology and production volume estimates for U.S. shale gas and tight oil plays to include seven additional plays, increasing the share of shale gas by about 9% and tight oil by 8% compared with previously estimated shale production volumes. The update captures increasing production from new, emerging plays as well as from older plays that had been in decline but are rebounding because of advancements in horizontal drilling and hydraulic fracturing. The selected plays are identified by examining the reservoir names reported by operators to state agencies. EIA uses the third party data source, Drillinginfo, which collects and distributes well level data gathered by the states.
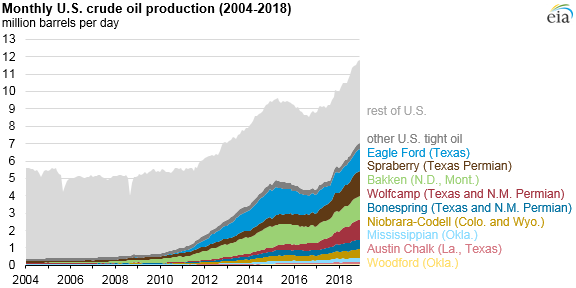
The most productive of the newly added plays is the Mississippian formation, which is located mainly in Oklahoma within the Anadarko Basin. The mainly carbonate rock type lies above the Woodford play and has produced liquids and natural gas for some time, but newer completion techniques have driven recent production gains.
The remaining six plays are smaller and are included in the rest of U.S. tight oil and shale gas categories.
- The Burket and Geneseo formations in the Appalachian Basin of Pennsylvania and West Virginia increased production in recent years. These dry shale gas formations lie above the Marcellus Shale but are thinner and do not cover as large an area as the Marcellus.
- The Uteland Butte member of the Green River Formation in the Uinta Basin of Utah is composed primarily of limestone, dolostone, and organic rich mudstones and siltstones.
- The Turner, Frontier, Sussex-Shannon, and Teapot-Parkman formations are located in the Powder River Basin of Wyoming and lie below and above the Niobrara formation, the basin’s primary hydrocarbon-bearing formation. They are mainly fine-grained sandstone with interbedded silt and shale
Because the collection and reporting of oil and natural gas production by state agencies can lag between 2 and 18 months, EIA’s methodology compensates by estimating the incomplete production data up to the latest report month (presently December 2018). For this reason, EIA volumes may differ from state agency data where reports from operators may be incomplete. Once final production data from state agencies become available, EIA data are revised to reflect the actual production data.
Region totals from EIA’s Drilling Productivity Report are the main input variable to guide the projections, supplemented with pipeline rates from PointLogic Energy, well completion data from FracFocus, and EIA’s survey data of monthly production by state. The methodology also includes an update of the wet-to-dry ratio used to calculate the dry gas volumes from the natural gas gross withdrawals received from the states through Drillinginfo. This ratio is derived from EIA’s Natural Gas Annual and from EIA’s Reserves Report.
Principal contributors: Jack Perrin, Emily Geary