Natural gas inventories end October just below the previous five-year average
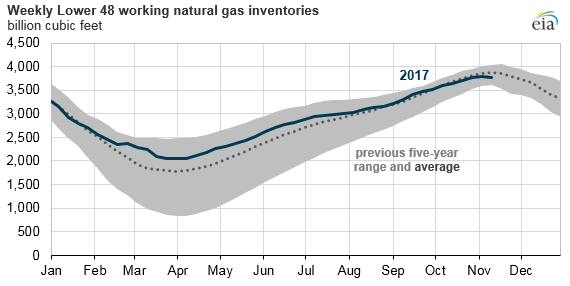
Working natural gas in storage in the Lower 48 states as of October 31, 2017, totaled 3,784 billion cubic feet (Bcf), as interpolated from EIA’s Weekly Natural Gas Storage Report data. Natural gas storage levels typically increase from April through October, although net injections sometimes occur in November. Inventories at the end of October 2017 were 2% lower than the previous five-year end-of-October average and 5% lower than the record-setting end-of-October level of 3,977 Bcf last year.
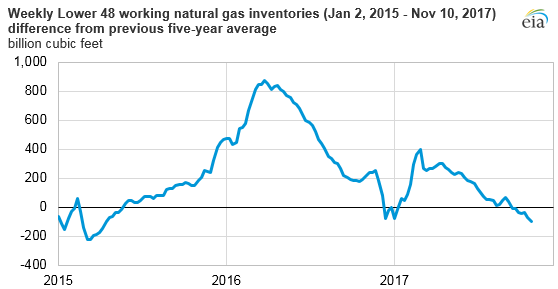
Injection levels during refill season level can vary considerably, depending in part on inventory levels at the start of the refill season. This year, relatively high inventory levels at the beginning of the injection season (April) would naturally have resulted in a slower-than-average pace of injections. Nevertheless, injections were insufficient to return inventories to their recent historical average. From May 2015 through mid-September 2017, working gas levels were higher than the five-year average for 118 out of 122 weeks. However, since late September 2017, working natural gas levels have been lower than the previous five-year average for seven consecutive weeks, based on data through November 10.
Natural gas storage is used to balance out seasonal fluctuations in demand. Natural gas demand is highest in the winter months, when residential and commercial demand for natural gas for space heating increases. Natural gas consumption in the power sector is highest in summer months, when overall electricity demand is relatively high for cooling.
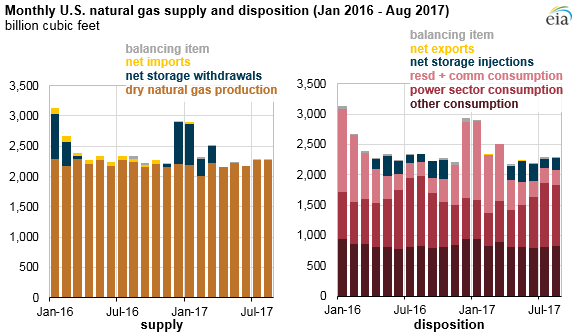
Based on data through August, year-over-year declines in electric power sector consumption have been partially offset by changes in natural gas trade, as exports have increased and imports have remained relatively flat. EIA’s latest Short-Term Energy Outlook expects the United States to be a net exporter of natural gas on an annual basis in 2017.
Principal contributors: Jose Villar, Owen Comstock