Almost 40% of global liquefied natural gas trade moves through the South China Sea
Note: Click to enlarge.
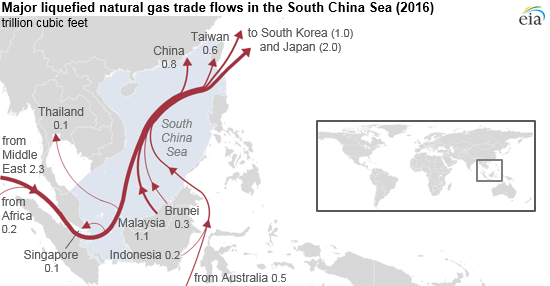
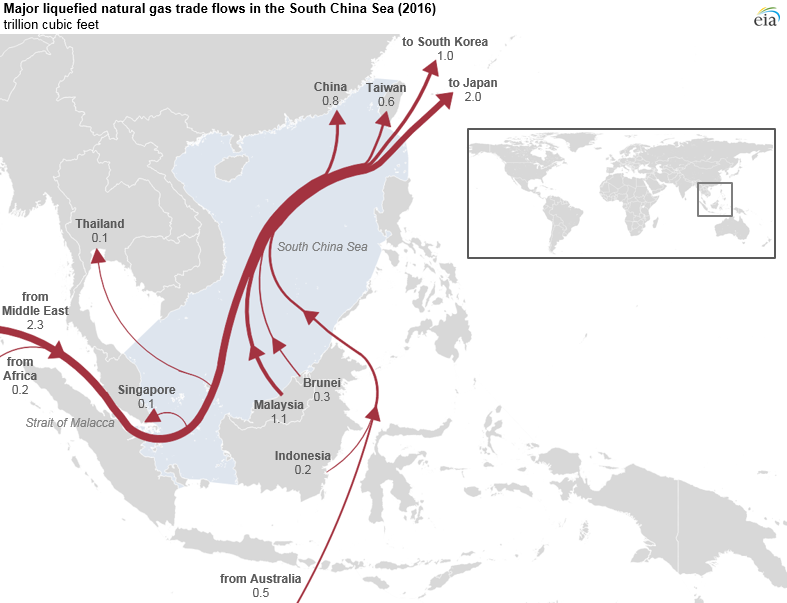
The South China Sea is a major route for liquefied natural gas (LNG) trade, and in 2016, almost 40% of global LNG trade, or about 4.7 trillion cubic feet (Tcf), passed through the South China Sea.
The South China Sea is an important trade route for Malaysia and Qatar. The two LNG exporters collectively accounted for more than 60% of total South China Sea LNG volumes in 2016. Almost half of Qatar’s global LNG shipments traveled through the South China Sea in 2016. All of Malaysia’s LNG exports pass through the South China Sea, as the country’s one LNG export complex lies on the South China Sea coast.
Several other LNG exporters also use South China Sea trade routes to reach LNG importers. In 2016, Oman, Brunei, and the United Arab Emirates shipped between 84% and 100% of their total LNG exports through the South China Sea.
Other LNG exporters in the region, such as Australia and Indonesia, make more use of other trade routes to reach LNG markets. In 2016, about 23% of total Australian LNG exports and about 29% of Indonesian LNG exports were shipped by way of the South China Sea. Much of the remainder of Australia’s and Indonesia’s LNG exports passed to the east of the Philippines and Taiwan, avoiding the South China Sea on the way to customers in Japan, South Korea, and northern China.

The four LNG importers with the largest volumes passing through the South China Sea are Japan, South Korea, China, and Taiwan, collectively accounting for 94% of total LNG volumes going through the South China Sea in 2016. Japan is the world’s largest LNG importer, and slightly more than half of all of Japan’s LNG imports in 2016 were shipped by way of the South China Sea. Similarly, about two-thirds of the LNG imported by South Korea—the world’s second-largest LNG importer—was shipped through the South China Sea that year.
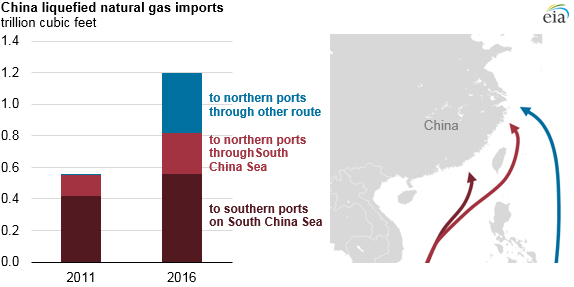
More than two-thirds of China’s LNG imports and more than 90% of Taiwan’s LNG imports passed through the South China Sea in 2016. Total imports of LNG to China have more than doubled over the previous five years, from 0.56 Tcf in 2011 to 1.20 Tcf in 2016. However, more than half of the growth in China’s LNG imports were volumes that went to northern ports without transiting the South China Sea. Based on projections in the International Energy Outlook 2017, EIA projects that China will surpass South Korea as the world’s second-largest LNG importer by 2018 and nearly match Japan’s level of LNG imports by 2040.
Principal contributors: Justine Barden, Kristin Jones, Kathleen Mehmedovic