Summer 2011 gasoline price review
Download CSV Data
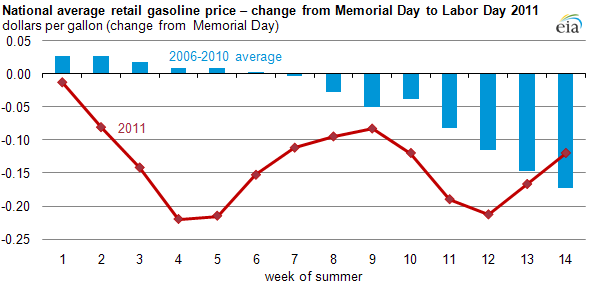
Regular grade gasoline prices declined quickly in June before rebounding moderately in July and August to a level on Labor Day that was 12 cents per gallon below the Memorial Day level. This price pattern differed from the pattern of recent years, when gasoline prices were stable for the first half of the summer before declining late in the summer to end up an average of 17 cents per gallon lower on Labor Day than Memorial Day.
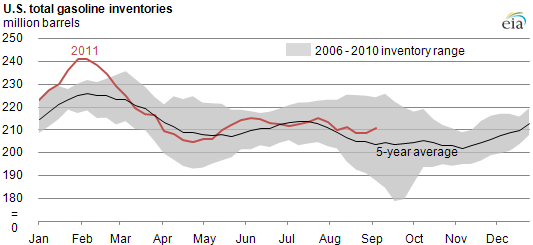
Although gasoline consumption generally peaks in July and August, the peak seasonal price usually occurs earlier. Only once in the last five years were average gasoline prices higher at the end of the summer than at the beginning; that was in 2009, when crude oil prices began to recover from their steep drop that happened in late 2008. One reason for this early 2011 gasoline price peak is refinery maintenance. Refineries usually undergo scheduled maintenance in the spring. This maintenance causes gasoline inventories to drop and markets to tighten. Gasoline inventories typically reach a seasonal low in May, at the end of this maintenance cycle, before building again in June.
Download CSV Data
The effect of refinery maintenance was stronger in 2011. In March and April, the effects of higher-than-normal levels of refinery maintenance on the Gulf and East Coasts, combined with unplanned outages and transportation issues related to Mississippi River flooding, resulted in a sharp draw on gasoline inventories. These tight supply conditions resulted in higher gasoline prices through the spring.
However, in late May refineries returned to normal production in the face of weak domestic gasoline demand. This led to larger-than-average inventory builds during May; consequently, the summer driving season opened with more supply than usual. The beginning of summer also coincided with concerns regarding deteriorating economic conditions, putting downward pressure on crude oil prices.
From the beginning of May through the end of June, the price of Louisiana Light Sweet crude oil decreased almost $20 per barrel. Even before Memorial Day, this decrease in the crude oil price was already pulling down retail gasoline prices, and it continued to be a major driver of the decline in retail prices throughout June. Typically, a $10-per-barrel change in the spot price of crude oil translates into about a 24-cent-per-gallon change in the retail price of gasoline within about two months. About half of that price change usually occurs within the first two weeks of the crude oil price change.
With the domestic gasoline demand weak and the downstream market largely free of disruptions in July and August, and with inventories tracking seasonally normal levels, crude prices continued to be the main driver of retail gasoline prices for the remainder of the summer. A recovery in crude prices in July and subsequent decline in August, on the back of continued global macroeconomic growth concerns, translated into a similar pattern for U.S. gasoline prices.