Reporting oil companies’ proved reserves in 2016 decline for second consecutive year
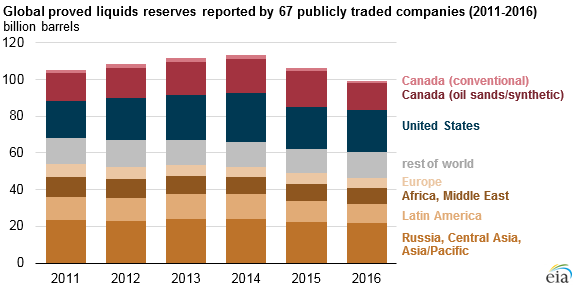
Note: Rest of world includes associated companies’ reserves with unspecified geographies.
Republished June 13, 2017, 4:30 p.m. to correct for double counting in company level reporting.
Annual reports of 67 publicly traded oil companies indicated that their aggregate proved liquids reserves declined in 2016 for the second consecutive year. The decline in proved reserves was heavily concentrated in a few companies that reduced their estimated reserves from Canadian oil sands projects. Downward revisions of existing resources, relatively low extensions and discoveries, and relatively high production also contributed to a decline in proved reserves.
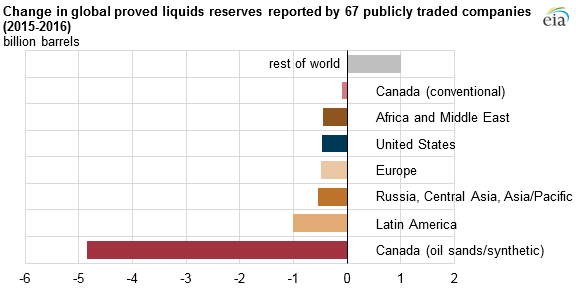
Note: Rest of world includes associated companies’ reserves with unspecified geographies.
The 67 oil companies included in this analysis are listed on U.S. stock exchanges and consequently are required to report their proved reserves annually to the U.S. Securities and Exchange Commission (SEC). Collectively, their global crude oil and other liquids production averaged 24 million barrels per day (b/d) during 2016, or about 25% of the global total.
Proved reserves are the estimated quantities of oil that, with reasonable certainty, are recoverable under existing economic and operating conditions. These company estimates are based on available geologic and engineering data, which change as technology develops. Price changes and other economic factors can have a significant effect on the economic viability of oil projects, and some companies specifically cited low crude oil prices in 2016 as a reason to revise their proved reserves base downward.
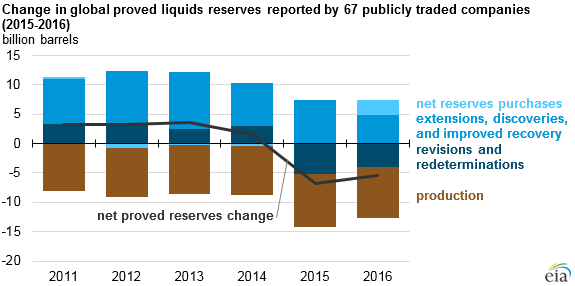
Extensions (more resources at existing fields) and discoveries (resources at new fields) represent newly found quantities of oil and totaled 4.9 billion barrels across the 67 companies in 2016. Following the crude oil price decline beginning in mid-2014, companies significantly reduced capital expenditures, especially in their exploration and development budgets. Instead, they focused on extracting additional oil from reserves developed in previous years.
Additions from extensions and discoveries and net purchases of reserves from companies not included in this analysis were offset by large negative revisions to company assessments of existing reserves. Reserves also declined as these companies collectively extracted 8.7 billion barrels of liquids in 2016. The combined effect of these changes and other factors was a net reduction of 5.4 billion barrels in proved reserves.
Later this year, EIA will issue an annual report that focuses exclusively on proved reserves located in the United States, including all U.S. producers, whether or not they are publicly traded. The relatively small change in the U.S. reserves component of global total reserves for the 67 companies whose reports were reviewed here suggests that EIA’s 2016 proved reserves report for the United States will show only modest changes from the 2015 report.
So far in 2017, capital expenditures remain lower than for the same period in 2016. Generally, larger companies with more production are reducing expenditures, while relatively smaller companies are increasing their capital expenditures.
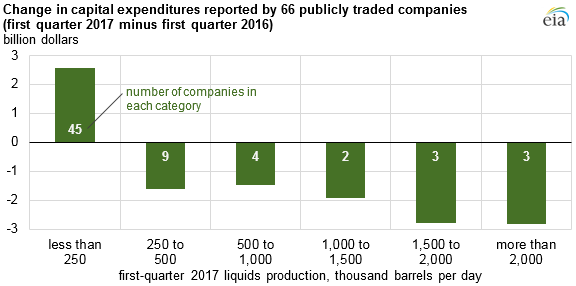
Note: Two companies merged in the first quarter of 2017, reducing the total number of companies in this analysis.
Forty-five of the companies in this analysis produced less than 250,000 b/d in the first quarter of 2017, and 28 of those 45 increased their capital expenditures compared with the first quarter of 2016. In aggregate, those 45 companies increased their capital expenditures by $2.6 billion. In contrast, 16 of the 21 companies producing more than 250,000 b/d in this analysis reduced capital expenditures. Those 21 companies, in aggregate, lowered their capital expenditures by $10.6 billion.
For additional oil company financial analysis, see EIA’s Financial Review 2016.
Principal contributor: Jeff Barron