U.S. energy production, consumption has changed significantly since 1908
On Tuesday, the Cleveland Indians are set to host the Chicago Cubs in game six of the 2016 Major League Baseball World Series. In the 68 years since the last title for the Cleveland Indians, and the 108 years since the last World Series title for the Chicago Cubs, energy production and consumption patterns in the United States have changed a great deal.
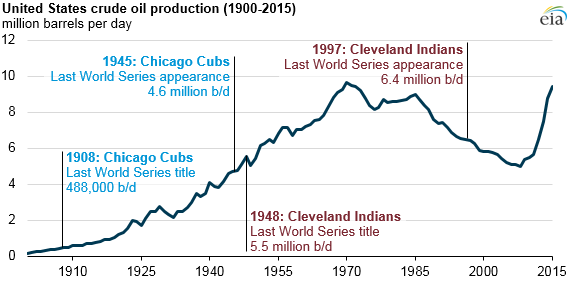
In 1908, the last time the Cubs won the World Series, the United States produced less than half a million barrels per day (b/d) of oil, with crude oil production having only started approximately 50 years earlier. At that time, crude oil was mainly refined to produce kerosene for use in lamps. The first Ford Model T automobile was produced in 1908, kicking off a shift in demand for petroleum products from kerosene for lamps to gasoline for automobiles.
The last time the Chicago Cubs made a World Series appearance, in 1945, the United States was producing 4.6 million b/d of crude oil. Production had been steadily increasing in the decades prior, as the economy grew and industry expanded following the Great Depression.
The last time the Cleveland Indians won the World Series, in 1948, the United States produced 5.5 million b/d of crude oil. Crude oil production had been steadily increasing since declines in the 1930s and would continue to increase until production declines in the 1970s. More recently, in 1997, the last time the Cleveland Indians appeared in the World Series, the United States produced 6.4 million b/d of oil, falling to the production levels of the 1950s.
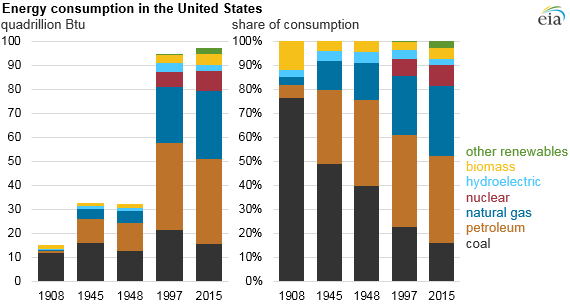
The consumption of energy in the United States has also changed significantly over the past hundred years. In 1908, the country consumed just 15 quadrillion British thermal units (Btu), of which three-quarters was coal. By the time the Cubs made their last World Series appearance, total energy consumption in the country had doubled. Coal was still the main fuel, but petroleum had also become a large source of energy consumption.
In comparison, the last time the Indians appeared in the World Series (1997), U.S. energy consumption had increased to totals closer to those seen today. Consumption in 1997 totaled 94 quadrillion Btu. Coal’s share had fallen to one-quarter of total consumption, and natural gas and nuclear made up a large share. Since then, the shares of natural gas and other renewables used to generate electricity have increased, resulting in a lower share of coal generation.
The share of nonhydro renewable consumption is actually lower today (10%) than it was in 1908 (15%). This is a factor of both lower energy consumption as a whole and a large amount of biomass (in this case wood) consumption 100 years ago. Today, while the nonhydro renewable share of total energy consumption is lower than in 1908, solar and wind generation continue to increase and make up a large percentage of total nonhydro renewables.
Despite the changes in fuel sources, fossil fuels have continued to make up a large percentage of U.S. energy consumption. In 1908, fossil fuels accounted for 85% of total consumption. When the Indians won the World Series in 1948, that share had increased to 91%, as petroleum and natural gas had begun to account for increasing amounts of energy consumption. Fossil fuel consumption has fallen in recent years, accounting for 81% of total consumption in 2015.
Principal contributors: Mason Hamilton, Mike Mobilia