U.S. oil companies closer to balancing capital investment with operating cash flow
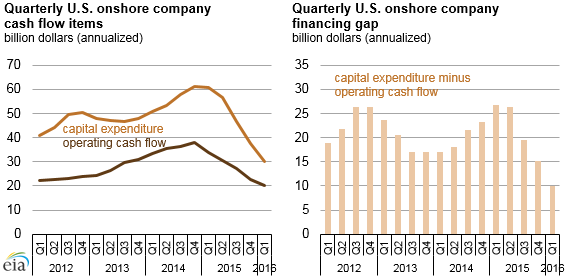
Note: The financing gap is the difference between cash from operations and from capital expenditure.
Although the crude oil price decline since 2014 has led to significant reductions in operating cash flow for U.S. oil companies, their immediate financial situations are improving. As oil companies' spending falls and crude oil prices increase, the need for oil companies to find external sources of funding may decline, which could reduce financial strain in the coming quarters.
First-quarter 2016 financial results from U.S. onshore producers reveal an improving balance between capital expenditure and operating cash flow. Although operating cash flow was the lowest in any quarter in the past five years, larger reductions to capital expenditure brought these companies closest to self-finance (when capital investment can be paid for entirely from operating cash flow). With crude oil prices such as the global benchmark Brent price averaging over $45 per barrel in the second quarter—a 34% increase from first-quarter 2016—cash flow may improve and help offset declining revenue from lower production.
The difference between operating cash flow and capital expenditure—known as free cash flow or the financing gap—represents whether a company can pay for its investment through its after-tax profits. Over the past five years, companies substantially increased investment spending to raise production. In 2012 and early 2013, operating cash flow was about half of capital expenditure, making external finance necessary to pay for investment in production growth.
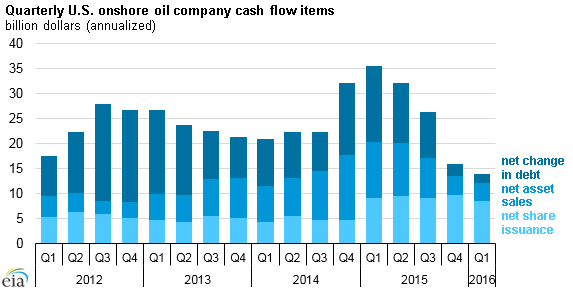
Sources of cash that do not come from operating activities typically come from:
- Selling property, equipment, other business segments, or other assets
- Issuing shares of stock
- Taking on debt, such as through borrowing from a bank or selling a bond
Operating cash flow has declined over the past year, but it nonetheless has covered an increasing share of capital expenditure as companies are reducing their investment budgets more quickly. Smaller investment budgets are lowering the amount of cash U.S. onshore oil producers need to raise through outside sources.
Capital expenditure decreases, however, may lead to further declines in production for U.S. oil producers. First-quarter 2016 was the first year-over-year decline in crude oil and other liquids production for these companies in the past five years, driven by declines from existing fields and a lack of new well drilling. Falling production would likely reduce revenue and cash flow absent an increase in crude oil prices.
The companies included in this analysis are 39 public U.S. crude oil producers operating only onshore fields. Their collective production averaged 2.1 million barrels per day, or approximately 30% of U.S. Lower 48 production in first-quarter 2016. These companies will release second-quarter 2016 results in mid-August.
Principal contributor: Jeff Barron