Ranking of renewable energy and nuclear energy use varies by sector
Note: Data for 2010 and 2011 are preliminary.
Download CSV Data: left chart / right chart
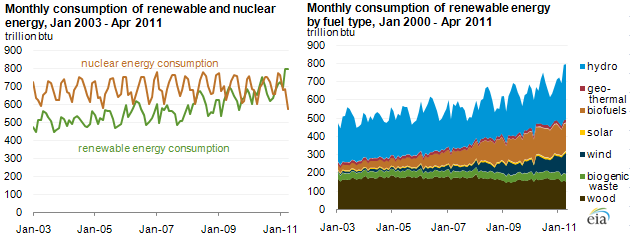
Consumption of primary energy derived from renewables recently exceeded current and historical consumption levels for nuclear energy. In the short term, nuclear outages coincided with the start of the high-water season for hydropower generation in March 2011, pushing renewable energy consumption past that of nuclear. The multi-year upward trend in renewable consumption is driven by increasing consumption of biofuels and wind capacity additions.
Consumption of nuclear and renewable energy both vary during the year. Nuclear power generation decreases in the spring and fall when nuclear power plants are shut down for refueling. Seasonal variations in renewable energy are dominated by the annual cycle of water availability for hydroelectric power production. Hydropower constitutes a significant yet highly variable portion of total renewable energy consumption, accounting for 31% of renewable energy consumption in 2010.
Renewable energy consumption encompasses more than just electric power generation from hydro, wind, solar, and geothermal sources. Other major sources of renewable energy include biofuels for transportation (such as ethanol and biodiesel) and biomass (such as wood and wood wastes) for space heating and industrial steam production as well as for electric power generation.
The various modes of energy consumption are put into common units (British thermal units, or Btu) for comparison purposes. The Btu value for electricity generated by certain noncombustible sources (wind, solar, geothermal, and hydro) is calculated using the average heat rate (the average efficiency in converting fuel into electricity) for fossil-fueled power plants. The result represents the amount of fossil fuel consumption that might be displaced by the renewable generation. This approach produces a value greater than the result of a simple kilowatthour-to-Btu conversion. Nuclear electricity is converted to Btu using a value analogous to a heat rate (reflecting the efficiency with which the steam produced by heat from the nuclear fission process is converted to electricity).
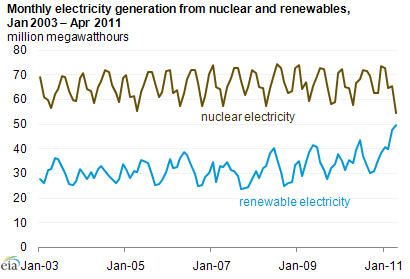
The chart below presents the electricity-only portion of primary energy data; the chart excludes other energy use such as transportation, heating, or industrial steam production. As indicated by the blue line, renewable electricity generation—a subset of renewable energy—remains slightly below nuclear generation.
Note: Data for 2010 and 2011 are preliminary.
Download CSV Data
Tags: biomass, consumption/demand, electricity, geothermal, nuclear, renewables