Last Monday’s large percentage decline in crude oil prices was relatively rare
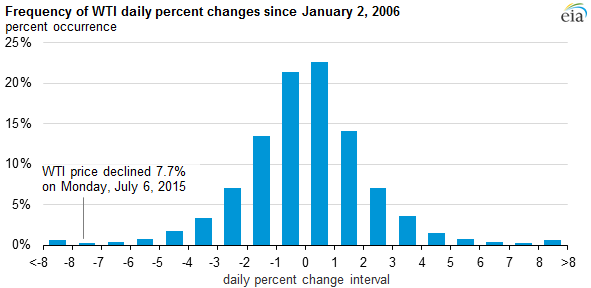
Note: Chart represents the number of times a daily percent change occurred in West Texas Intermediate (WTI) crude oil prices since January 2, 2006.
The front-month futures price for crude oil benchmark West Texas Intermediate (WTI) declined 7.7% on Monday, July 6, the largest single-day decline in percentage terms since February 4. With this decline, oil prices fell below the trading range established over the past few months. Uncertainty over Greece's fiscal position, volatility in the Chinese stock market, and uncertain prospects for a nuclear deal with Iran were all cited as immediate factors affecting expectations for future crude oil supply and demand. Other market indicators over the past few weeks, such as the stabilization of the U.S. rig count and growing petroleum product inventories, may have also contributed to lower prices.
Single-day declines of this size are very rare in oil markets. Historical daily oil price movements are close to being normally distributed, with small daily increases and large daily decreases occurring slightly more frequently than would be expected in a perfect normal distribution. Since January 2, 2006, the average daily percentage change for the front month WTI crude oil contract was close to zero, at 0.002%, and in that time daily price movements had a standard deviation of more than 2%.
Using history as a guide, the downward price movement of 7.7% on Monday, July 6, was more than 3 standard deviations below the average daily change. With the assumption that daily oil prices are independent (i.e., one day's movements do not influence another day's movements) and are normally distributed, a decline of Monday's magnitude would, in theory, have a 0.05% chance of occurring, or about one in 2,000. Historically, since January 2, 2006, 15 trading days (out of a total of 2,394) recorded a larger price decline.
Crude oil price volatility remains elevated, driven by uncertainty over future global economic growth and oil production levels. WTI implied volatility, an expectation of future price movements calculated from the prices of futures and options contracts, averaged 36.5% from July 1 to July 7, higher than both the June average and the comparable year-ago period.
Principal contributor: James Preciado