Because of cold start, average natural gas spot prices were higher in 2014
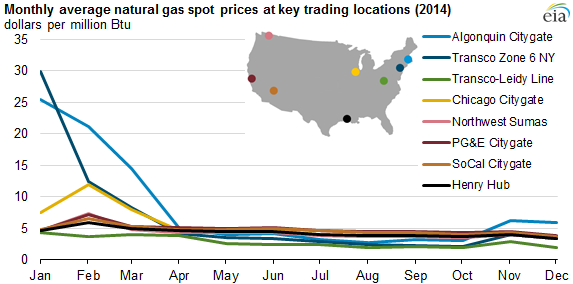
Driven by higher prices during the first three months of 2014, average wholesale (spot) prices for natural gas increased by 20% or more at most trading locations in the United States in 2014 compared to 2013. The average price of natural gas at Henry Hub in Erath, Louisiana, the primary benchmark location for natural gas pricing in the United States, rose 17% to $4.37 per million British thermal units (MMBtu) from the 2013 average price of $3.73/MMBtu. In calculating the annual average, those early high prices overwhelmed current prices that are in the $3/MMBtu range.
With colder-than-normal temperatures in January through March, residential and commercial demand for natural gas increased, raising prices at most trading locations. The increased demand also led to record-breaking natural gas storage withdrawals at the beginning of the year. In particular, the combination of high demand and continued pipeline constraints into the Northeast contributed to record-high prices in New York and New England during that period.
Mild summer temperatures reduced the need for air conditioning, and in turn limited the consumption of natural gas by the electric power sector. The reduced demand and continued production gains enabled record natural gas storage injections from April through mid-November. During this period, natural gas prices fell nationwide.
At the end of 2014, with moderate winter temperatures compared to the previous year, and storage levels above last year's inventory, natural gas prices remained unseasonably low at most trading locations. Still, the high prices in the first three months more than offset lower prices in the rest of the year, resulting in an overall increase in annual prices.
On a monthly basis, prices were highest in January or February at most trading locations. However, these monthly prices mask wide differences in daily prices, which in some locations, particularly in the Northeast, surpassed $35/MMBtu.
Source: U.S. Energy Information Administration, based on Natural Gas Intelligence (NGI)
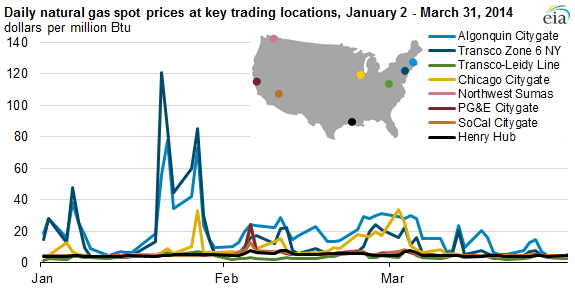
As frigid temperatures led to higher natural gas demand in the 2013-14 winter, record-breaking weekly storage withdrawals occurred, driving storage levels below their five-year minimum. Prices at the Henry Hub approached $8/MMBtu, and during this three-month period were on average 48% higher than in the same period during 2013. The prolonged winter experienced throughout much of the United States brought working gas inventories to an 11-year low of 822 billion cubic feet at the end of March.
In New York and New England, prices spiked during periods of peak demand, largely as a result of persistent infrastructure constraints. During the first three months of 2014, prices at Algonquin Citygate (serving Boston) and Transcontinental Pipeline's Zone 6 NY (which serves New York City and is also known as Transco Z6 NY) were often three or four times higher than the Henry Hub, with Algonquin and Transco Z6 NY reaching record levels of $77.60/MMBtu and $120.75/MMBtu, respectively, in January. During January and February the spot natural gas price at the Algonquin Citygate hub averaged $23.42/MMBtu.
Prices at the Chicago Citygate, which even in winter are normally in line with Henry Hub, also spiked in response to the severe winter weather. On January 28, one of the coldest days of the year, Chicago Citygate reached a 10-year high of $33.23/MMBtu.
The winter cold caused spot prices to increase in western regions as well, with PG&E Citygate (California) and Northwest Sumas (Washington) prices both moving up in early February to $24.55/MMBtu and $24.52/MMBtu, respectively.
Source: U.S. Energy Information Administration, based on Natural Gas Intelligence (NGI)
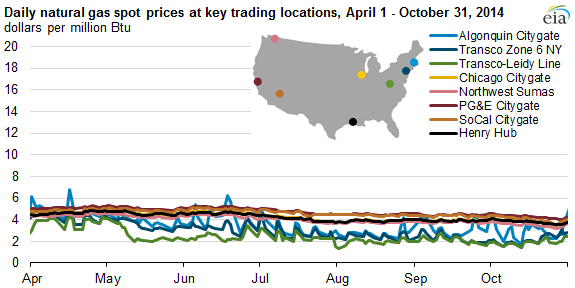
Low inventory levels supported higher spot prices at the Henry Hub, which averaged $4.63/MMBtu in April 2014, 12% higher than the level in April 2013. However, prices fell from April through October, as the demand for natural gas from the power sector remained low through the spring and summer with mild temperatures, decreasing air-conditioning load. Consumption of natural gas in the electric power sector during this period was about 2% lower than the same period in 2013 and 16% below those months in 2012. Still, Henry Hub spot prices April through October averaged $4.21/MMBtu, 12% higher than 2013.
Prices in the Marcellus production area of Pennsylvania and West Virginia, which are typically among the lowest in the country because of constrained pipeline takeaway capacity, fell below $2/MMBtu at the end of July. Prices at Transcontinental's Leidy Line, a key price point for Marcellus natural gas, declined between 2013 and 2014. Although there are several pipeline projects underway to improve takeaway, only a few of these pipelines went into service in 2014.
From April through October, prices at Transco Z6 NY and Algonquin Citygate traded below the Henry Hub on most days. Although these points have traded at a discount to Henry Hub at times in previous years, 2014 represents the first time that the prices were persistently lower, with prices at Transco Z6 NY and Algonquin settling below the Henry Hub 99% and 77% of the time, respectively, from April through October.
Source: U.S. Energy Information Administration, based on Natural Gas Intelligence (NGI)
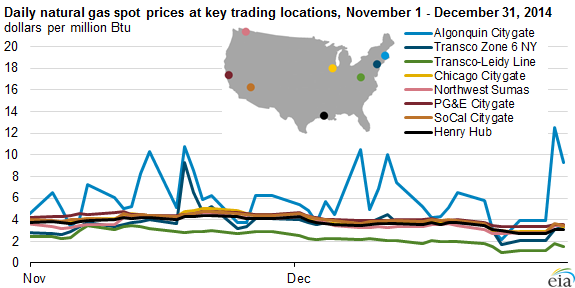
Seasonally warm temperatures during the last two months of 2014, particularly in December, kept natural gas prices at the Henry Hub 9% lower than prices during those months in 2013. The relatively mild winter weather led to lower storage withdrawals for most weeks in November and December, with storage inventories surpassing their year-ago levels by December 12, and coming within 2.5% of the five-year average by December 26. At the end of December, the price for the prompt month natural gas futures contract at the New York Mercantile Exchange fell below $3/MMBtu for the first time since 2012.
Although there were higher prices at the Algonquin Citygate during brief cold spells at the end of 2014, prices were significantly lower there than at the end of 2013.
Principal contributor: Scott Bradley
Tags: natural gas, spot prices, weather