Mississippi Quick Facts
- The 1,443-megawatt Grand Gulf Nuclear Power Station in Port Gibson, Mississippi, is the largest single-reactor nuclear power plant by generating capacity in the nation. The plant generated about 17% of the state's electricity in 2022.
- Mississippi's Pascagoula oil refinery is the nation's 10th-largest refinery, with the capacity to process about 356,000 barrels of oil per calendar day into motor gasoline, diesel fuel, and other petroleum products.
- Mississippi is one of the few states with large underground salt caverns capable of storing natural gas, and the state has about one-fourth of total U.S. underground salt cavern natural gas storage capacity.
- Natural gas accounted for 76% of Mississippi's electricity net generation in 2022 and was the primary fuel used at 9 of the state's 10 largest power plants.
- Mississippi ranks among the 5 states with the lowest average gasoline prices, but among the top 10 states with the highest annual per capita gasoline expenditures.
Last Updated: October 19, 2023
Data
Last Update: April 18, 2024 | Next Update: May 16, 2024
| Prices | |||||
|---|---|---|---|---|---|
| Petroleum | Mississippi | U.S. Average | Period | find more | |
| Domestic Crude Oil First Purchase | $ 72.56 /barrel | $ 72.26 /barrel | Jan-24 | ||
| Natural Gas | Mississippi | U.S. Average | Period | find more | |
| City Gate | $ 4.59 /thousand cu ft | $ 4.76 /thousand cu ft | Jan-24 | find more | |
| Residential | $ 10.63 /thousand cu ft | $ 11.82 /thousand cu ft | Jan-24 | find more | |
| Coal | Mississippi | U.S. Average | Period | find more | |
| Average Sales Price | W | $ 54.46 /short ton | 2022 | ||
| Delivered to Electric Power Sector | W | $ 2.48 /million Btu | Jan-24 | ||
| Electricity | Mississippi | U.S. Average | Period | find more | |
| Residential | 12.72 cents/kWh | 15.45 cents/kWh | Jan-24 | find more | |
| Commercial | 11.13 cents/kWh | 12.68 cents/kWh | Jan-24 | find more | |
| Industrial | 6.94 cents/kWh | 8.10 cents/kWh | Jan-24 | find more | |
| Reserves | |||||
|---|---|---|---|---|---|
| Reserves | Mississippi | Share of U.S. | Period | find more | |
| Crude Oil (as of Dec. 31) | 119 million barrels | 0.3% | 2021 | find more | |
| Expected Future Production of Dry Natural Gas (as of Dec. 31) | 246 billion cu ft | * | 2021 | find more | |
| Expected Future Production of Natural Gas Plant Liquids | 0 million barrels | 0.0% | 2021 | find more | |
| Recoverable Coal at Producing Mines | 102 million short tons | 0.9% | 2022 | find more | |
| Rotary Rigs & Wells | Mississippi | Share of U.S. | Period | find more | |
| Natural Gas Producing Wells | 1,257 wells | 0.3% | 2020 | find more | |
| Capacity | Mississippi | Share of U.S. | Period | ||
| Crude Oil Refinery Capacity (as of Jan. 1) | 393,940 barrels/calendar day | 2.2% | 2023 | ||
| Electric Power Industry Net Summer Capacity | 14,847 MW | 1.2% | Jan-24 | ||
| Supply & Distribution | |||||
|---|---|---|---|---|---|
| Production | Mississippi | Share of U.S. | Period | find more | |
| Total Energy | 325 trillion Btu | 0.3% | 2021 | find more | |
| Crude Oil | 36 thousand barrels per day | 0.3% | Jan-24 | find more | |
| Natural Gas - Marketed | 28,493 million cu ft | 0.1% | 2022 | find more | |
| Coal | 3,369 thousand short tons | 0.6% | 2022 | find more | |
| Total Utility-Scale Net Electricity Generation | Mississippi | Share of U.S. | Period | find more | |
| Total Net Electricity Generation | 6,789 thousand MWh | 1.8% | Jan-24 | ||
| Utility-Scale Net Electricity Generation (share of total) | Mississippi | U.S. Average | Period | ||
| Petroleum-Fired | * | 0.4 % | Jan-24 | find more | |
| Natural Gas-Fired | 78.8 % | 42.2 % | Jan-24 | find more | |
| Coal-Fired | 5.4 % | 19.9 % | Jan-24 | find more | |
| Nuclear | 13.6 % | 18.2 % | Jan-24 | find more | |
| Renewables | 2.2 % | 18.8 % | Jan-24 | ||
| Stocks | Mississippi | Share of U.S. | Period | find more | |
| Motor Gasoline (Excludes Pipelines) | 1,567 thousand barrels | 13.0% | Jan-24 | ||
| Distillate Fuel Oil (Excludes Pipelines) | 1,645 thousand barrels | 1.7% | Jan-24 | find more | |
| Natural Gas in Underground Storage | 208,661 million cu ft | 2.9% | Jan-24 | find more | |
| Petroleum Stocks at Electric Power Producers | 5 thousand barrels | * | Jan-24 | find more | |
| Coal Stocks at Electric Power Producers | W | W | Jan-24 | find more | |
| Fueling Stations | Mississippi | Share of U.S. | Period | ||
| Motor Gasoline | 1,992 stations | 1.8% | 2021 | ||
| Propane | 71 stations | 2.9% | Mar-24 | ||
| Electric Vehicle Charging Locations | 145 stations | 0.2% | Mar-24 | ||
| E85 | 5 stations | 0.1% | Mar-24 | ||
| Biodiesel, Compressed Natural Gas, and Other Alternative Fuels | 2 stations | 0.1% | Mar-24 | ||
| Consumption & Expenditures | |||||
|---|---|---|---|---|---|
| Summary | Mississippi | U.S. Rank | Period | ||
| Total Consumption | 1,086 trillion Btu | 29 | 2021 | find more | |
| Total Consumption per Capita | 368 million Btu | 15 | 2021 | find more | |
| Total Expenditures | $ 13,633 million | 31 | 2021 | find more | |
| Total Expenditures per Capita | $ 4,622 | 12 | 2021 | find more | |
| by End-Use Sector | Mississippi | Share of U.S. | Period | ||
| Consumption | |||||
| » Residential | 190 trillion Btu | 0.9% | 2021 | find more | |
| » Commercial | 148 trillion Btu | 0.8% | 2021 | find more | |
| » Industrial | 397 trillion Btu | 1.2% | 2021 | find more | |
| » Transportation | 351 trillion Btu | 1.3% | 2021 | find more | |
| Expenditures | |||||
| » Residential | $ 2,574 million | 0.9% | 2021 | find more | |
| » Commercial | $ 1,819 million | 0.9% | 2021 | find more | |
| » Industrial | $ 2,196 million | 0.9% | 2021 | find more | |
| » Transportation | $ 7,044 million | 1.2% | 2021 | find more | |
| by Source | Mississippi | Share of U.S. | Period | ||
| Consumption | |||||
| » Petroleum | 75 million barrels | 1.0% | 2021 | find more | |
| » Natural Gas | 605 billion cu ft | 1.9% | 2022 | find more | |
| » Coal | 4,984 thousand short tons | 1.0% | 2022 | find more | |
| Expenditures | |||||
| » Petroleum | $ 7,935 million | 1.0% | 2021 | find more | |
| » Natural Gas | $ 4,026 million | 1.5% | 2022 | find more | |
| » Coal | $ 262 million | 1.0% | 2022 | find more | |
| Consumption for Electricity Generation | Mississippi | Share of U.S. | Period | find more | |
| Petroleum | 2 thousand barrels | 0.1% | Jan-24 | find more | |
| Natural Gas | 39,510 million cu ft | 3.4% | Jan-24 | find more | |
| Coal | 293 thousand tons | 0.7% | Jan-24 | find more | |
| Energy Source Used for Home Heating (share of households) | Mississippi | U.S. Average | Period | ||
| Natural Gas | 29.0 % | 46.2 % | 2022 | ||
| Fuel Oil | 0.1 % | 3.9 % | 2022 | ||
| Electricity | 59.2 % | 41.3 % | 2022 | ||
| Propane | 10.1 % | 5.0 % | 2022 | ||
| Other/None | 1.7 % | 3.5 % | 2022 | ||
| Environment | |||||
|---|---|---|---|---|---|
| Renewable Energy Capacity | Mississippi | Share of U.S. | Period | find more | |
| Total Renewable Energy Electricity Net Summer Capacity | 728 MW | 0.2% | Jan-24 | ||
| Ethanol Plant Nameplate Capacity | -- | -- | 2023 | ||
| Renewable Energy Production | Mississippi | Share of U.S. | Period | find more | |
| Utility-Scale Hydroelectric Net Electricity Generation | 0 thousand MWh | 0.0% | Jan-24 | ||
| Utility-Scale Solar, Wind, and Geothermal Net Electricity Generation | 44 thousand MWh | 0.1% | Jan-24 | ||
| Utility-Scale Biomass Net Electricity Generation | 102 thousand MWh | 2.5% | Jan-24 | ||
| Small-Scale Solar Photovoltaic Generation | 2 thousand MWh | * | Jan-24 | ||
| Fuel Ethanol Production | 0 thousand barrels | 0.0% | 2021 | ||
| Renewable Energy Consumption | Mississippi | U.S. Rank | Period | find more | |
| Renewable Energy Consumption as a Share of State Total | 6.4 % | 41 | 2021 | ||
| Fuel Ethanol Consumption | 3,899 thousand barrels | 29 | 2021 | ||
| Total Emissions | Mississippi | Share of U.S. | Period | find more | |
| Carbon Dioxide | 63.1 million metric tons | 1.3% | 2021 | ||
| Electric Power Industry Emissions | Mississippi | Share of U.S. | Period | find more | |
| Carbon Dioxide | 27,308 thousand metric tons | 1.7% | 2022 | ||
| Sulfur Dioxide | 11 thousand metric tons | 1.0% | 2022 | ||
| Nitrogen Oxide | 16 thousand metric tons | 1.3% | 2022 | ||
Analysis
Last Updated: October 19, 2023
Overview
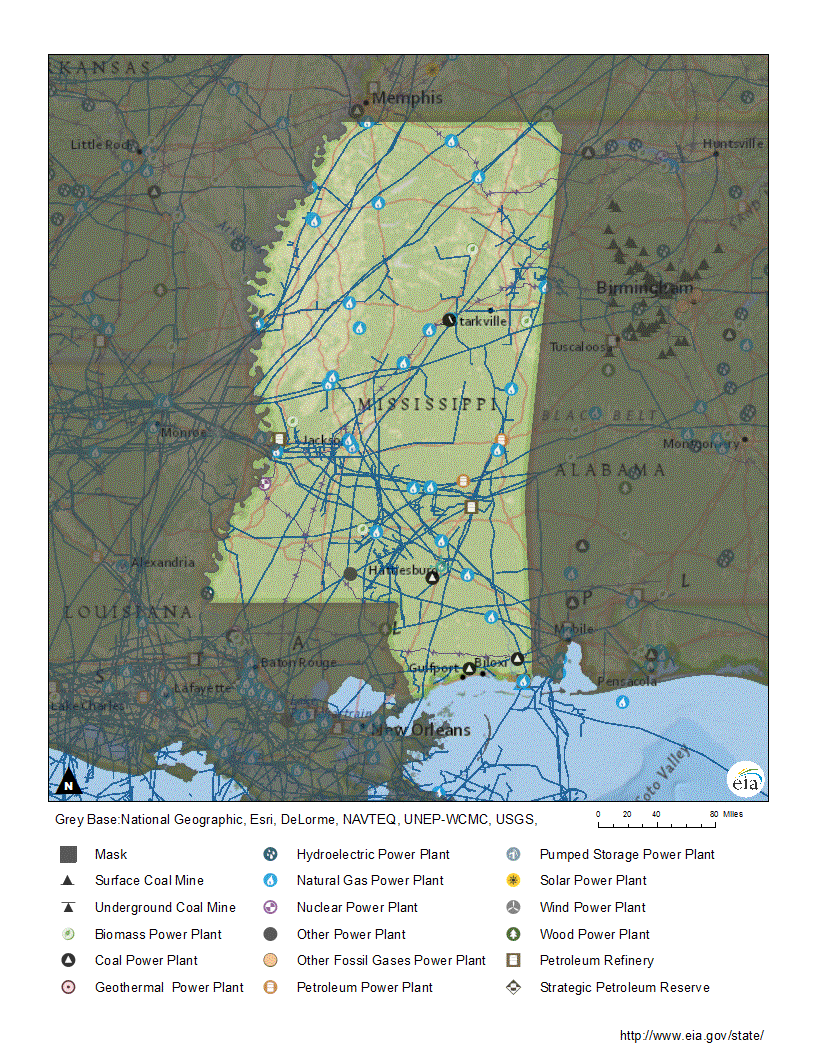
Located on the nation's Gulf Coast and bordered on the west by the river that shares its name, Mississippi has substantial energy infrastructure. The state has many natural gas, crude oil, and refined product pipelines. Mississippi's larger ports—located on the Gulf of Mexico and the Mississippi River—handle coal, crude oil, petroleum coke, and refined petroleum products.1 Although it is not as rich in crude oil and natural gas resources as some of its neighboring states, Mississippi has the nation's largest nuclear power reactor and 10th-largest petroleum refinery, along with a large natural gas processing plant and a liquefied natural gas terminal located along the state's Gulf of Mexico coastline.2,3,4,5,6,7
Mississippi has a humid subtropical climate with long, hot summers, mild winters, and abundant rainfall. Its rich soils, especially between the Mississippi River and the Yazoo River, provide fertile farmland where soybeans, corn, and cotton are the most valuable crops. Although agriculture played a central role in Mississippi's economy in the past, manufacturing is now the leading contributor to the state's gross domestic product (GDP).8,9,10 The manufacture of motor vehicles and other transportation equipment; food, beverage, and tobacco products; machinery; wood products, as well as petroleum and coal products, are substantial contributors to the state's economy.11
Mississippi consumes about three times more energy than it produces.
Mississippi has an energy-intensive economy and ranks sixth among the states in the amount of energy used to produce one dollar of GDP.12 The industrial sector consumes the most energy in Mississippi—nearly two-fifths of the state total—followed by the transportation sector at about one-third. The residential sector accounts for slightly less than one-fifth of state energy use and the commercial sector accounts for one-seventh.13 The strong demand for electricity for cooling during summer and heating in winter, along with the state's energy-intensive industries, puts Mississippi among the top one-third of states in total per capita energy consumption.14,15 Overall, Mississippi consumes about three times more energy than it produces.16
Petroleum
Mississippi produces about 0.3% of the nation's crude oil and holds about 0.3% of U.S. total proved oil reserves.17,18 Most of Mississippi's oil fields are located in the southern half of the state.19,20 Since 2015, Mississippi's oil production has steadily declined as its oil fields matured. In 2022, the state's annual oil production fell under 13 million barrels for the first time in more than 70 years and was well below the peak output of 65 million barrels in 1970.21,22,23,24
Mississippi has three petroleum refineries with a combined processing capacity of about 394,000 barrels of crude oil per calendar day, and together the facilities account for about 2% of the nation's total refining capacity.25 The Pascagoula refinery, which marked its 60th anniversary in 2023 and is the nation's 10th-largest refinery, is located on Mississippi's Gulf coast and supplies motor gasoline, jet fuel, diesel fuel, and other petroleum products to markets in the southeastern United States and other countries.26 Another refinery, the Ergon facility in Vicksburg on the Mississippi River, is a leading global manufacturer of naphthenic process oils, which are used worldwide in many industrial applications such as printing inks, transformer oils, refrigeration oils, and adhesives.27 The state's smallest refinery, located in Sandersville, supplies mostly asphalt products.28,29 Mississippi receives additional petroleum products from Texas and Louisiana via two major interstate petroleum product pipelines—the Colonial Pipeline and PPL Pipeline (formerly known as the Plantation Pipeline)—that move motor gasoline and other refined products through Mississippi to supply half a dozen other southern and eastern states.30,31,32
About 10 in 100 Mississippi households use propane as their main heating fuel, which is double the national rate.
Petroleum accounts for slightly more than one-third of the total energy consumed in Mississippi.33 Most of the petroleum used in the state is consumed in the transportation sector, primarily as motor gasoline.34 Conventional gasoline without ethanol can be sold statewide, although almost all U.S. gasoline is blended with at least 10% ethanol.35,36 Mississippi ranks among the 5 states with the lowest average gasoline prices, but among the top 10 states with the highest gasoline expenditures per capita.37 About 10 in 100 households in Mississippi use propane as their primary home heating fuel, double the national rate.38
Natural gas
Mississippi has few natural gas reserves and accounts for about only 0.1% of the nation's marketed natural gas production.39,40 The state's natural gas production has declined over the past decade, falling to less than half its 2011 output in 2021.41
Mississippi has about one-fourth of the nation’s underground salt cavern natural gas storage capacity.
Mississippi receives natural gas from the many interstate natural gas pipelines that cross the state.42 Natural gas supplies move into the state mainly by way of Louisiana, Alabama, and Tennessee. The state also receives some natural gas from offshore production platforms in federal waters in the Gulf of Mexico. Nearly 90% of the natural gas that enters Mississippi by interstate pipelines continues on to other states, with more than four-fifths of that natural gas moving through Alabama and Louisiana.43 Some of that natural gas that enters Mississippi stays in the state in underground storage caverns. Mississippi is one of the few states with large underground salt caverns capable of storing natural gas and the state has about one-fourth of the nation's salt cavern storage capacity. Five of the state's 11 underground natural gas storage fields are salt caverns and 6 are depleted oil and gas fields. They can hold a combined 331 billion cubic feet of natural gas, which is almost 4% of the nation's total underground storage capacity.44
One of the largest natural gas processing plants in the United States is in Mississippi. The plant, near Pascagoula on the Gulf Coast, separates natural gas liquids from the natural gas and can process up to 1 billion cubic feet of natural gas per day.45,46 Mississippi also has a liquefied natural gas (LNG) import terminal near Pascagoula that can regasify up to 1.5 billion cubic feet of LNG imports a day.47,48 With U.S. natural gas production rising to record levels almost every year since 2010, the terminal's owners received federal approval in 2019 to add export capability of up to 1.5 billion cubic feet of LNG per day from the site. However, the terminal's LNG export capacity has not been built.49,50,51,52
The electric power sector accounts for slightly more than two-thirds of Mississippi's natural gas consumption, and the sector's natural gas use has increased by nearly 50% over the past decade. The industrial sector consumes the second-largest amount of natural gas and accounts for about one-fourth of the state's natural gas use. The residential and commercial sectors each account for about 4% of the state's remaining natural gas consumption.53,54 About 3 out of 10 households in Mississippi rely on natural gas for home heating.55
Coal
All of the coal mined in Mississippi is lignite, which comes from one mine in Choctaw County.
Mississippi has about 1% of the nation's recoverable coal reserves at producing mines.56 All of the state's coal production comes from one mine that supplies lignite, which has a lower heating value and higher moisture content than other types of coal.57,58 The Red Hills surface coal mine, located in Choctaw County, Mississippi, sends all of its lignite output to fuel a nearby power plant.59 A second coal mine that was to provide lignite to a new advanced integrated coal gasification combined-cycle power plant in Kemper County ceased operations in 2018 after the power plant's owners stopped using coal gasification for power generation at the facility. The 582-megawatt plant now uses natural gas.60,61,62,63 About two-thirds of the coal consumed in Mississippi is mined in the state, and the rest comes primarily from Wyoming. Almost all the coal used in Mississippi is consumed by the state's two coal-fired power plants.64,65
Electricity
Mississippi has the largest nuclear power reactor by generating capacity in the United States.
Natural gas accounted for 76% of Mississippi's in-state net generation in 2022 and fueled 9 of the state's 10 largest power plants.66,67 Nuclear power was the second-largest provider of in-state electricity in 2022, accounting for 135 of Mississippi's generation. The Grand Gulf Nuclear Power Station is the largest single-reactor nuclear power plant by generating capacity in the nation and 11th largest in the world.68,69,70 Coal fueled 8% of the state's net generation in 2022, the highest amount of total coal-fired generation in eight years, but down from about 13% a decade earlier. Biomass and solar energy provided most of the rest of the state's net generation.71
Mississippi generated a record amount of electricity in 2022. The state typically produces about one-fourth more electricity than it uses, and the surplus power is sent to other states over the regional grid.72,73 The residential sector is the largest power consumer in the state, accounting for two-fifths of the state's total electricity use, followed by the industrial sector at about one-third, and the commercial sector at about three-tenths.74 Air-conditioning use during the state's hot summer months and the widespread use of electricity for home heating during the mild winter months drives demand for electricity from Mississippi's residential sector. About 6 out of 10 of the state's households use electricity for home heating.75,76,77 Mississippi ranks among the top five states in residential sector electricity sales on a per capita basis.78
Renewable energy
Biomass and solar energy account for Mississippi’s electricity generation from renewables.
Renewable resources generated almost 3% of Mississippi's utility-scale electricity in 2022. Biomass from wood and wood waste accounted for about 70% of the state's renewable electricity.79 With almost two-thirds of the state forested and more than one-fourth of the state's land used for agriculture, Mississippi has abundant biomass resources, including: logging residue, municipal landfills, crop residues, poultry litter, and livestock manure.80,81 Some biomass resources also provide the feedstock for the state's two wood pellet manufacturing plants, whose combined production capacity is 590,000 tons of pellets per year, which is about 5% of the U.S. total.82
In 2022, solar energy provided about three-tenths of Mississippi's electricity generation from renewables. Utility-scale (1 megawatt or larger) solar power generation, although small at just 0.8% of the state's total generation, has increased rapidly in recent years. Mississippi's first utility-scale solar facility came online in late 2016, and the state's total annual solar generation was nearly six times greater by 2022.83 The state's largest solar generating facility is a 100-megawatt solar farm in the northwest corner of the state that began operating in September 2022. Another 750 megawatts of solar power generating capacity and connected battery storage are scheduled to come online in 2023, including a 200-megawatt solar farm in the northeast corner of the state at the end of the year.84,85
Mississippi's best wind resources are found in the northwest corner of the state, but there are no utility-scale wind power facilities operating in the state.86,87 That will change in mid-June 2024, when Mississippi's first utility-scale wind farm is expected to come online. The Delta wind farm will have 41 turbines with a total generating capacity of 185 megawatts and will be able to provide electricity to almost 80,000 homes annually.88,89,90,91 In June 2021, the U.S. Department of the Interior proposed leasing tracts in federal waters off the Mississippi coastline for commercial wind power development. However, the department determined there was not sufficient commercial interest in developing Mississippi's offshore wind resources, and instead leased areas to develop wind resources in the Gulf of Mexico off Louisiana and Texas.92,93,94 While Mississippi has several dams with hydropower potential, they are all non-powered, and there is no utility-scale hydroelectric generation in the state. Mississippi and Delaware are the only two states with no hydroelectric facilities.95,96,97
Mississippi does not have a renewable portfolio standard requiring electricity suppliers to obtain specific amounts of their power from renewable energy sources.98 The state does offer limited net metering for small, customer-sited solar generation, like rooftop solar panels. In July 2022, Mississippi's Public Utility Commission updated the state's net metering rules to require utilities to give $3,500 rebates to lower-income residents who install solar power systems. As of mid-2023, Mississippi's total installed small-scale (less than 1 megawatt) solar power generating capacity, mostly residential rooftop solar panels, was the fourth lowest among the states.99,100,101
Mississippi has two biodiesel production plants that have an annual combined output capacity of about 29 million gallons. The state consumes about 23 million gallons of biodiesel a year, which is about 1% of the U.S. total.102,103 Mississippi has no ethanol production plants, but the state consumes almost 164 million gallons of fuel ethanol annually, which accounts for about 1% of the U.S. total.104,105
Endnotes
1 World Port Source, Mississippi United States, Port Index, accessed September 15, 2023.
2 U.S. Energy Information Administration (EIA), Crude Oil Proved Reserves, Reserves Changes, and Production, 2016-21.
3 U.S. EIA, Natural Gas Reserves Summary as of Dec. 31, Dry Natural Gas, 2016-21.
4 U.S. EIA, U.S. Energy Atlas, All Energy Infrastructure and Resources, Mississippi, accessed September 15, 2023.
5 Kinder Morgan, Natural Gas Pipelines, Gulf LNG, accessed September 15, 2023.
6 U.S. EIA, Energy Explained, Oil and petroleum products explained, Top 10 U.S. refineries operable capacity, January 1, 2023.
7 U.S. EIA, Nuclear Reactor, State, and Net Capacity (September 2021).
8 Mississippi State University, Department of Geosciences, Office of the Mississippi State Climatologist, Mississippi Climate, accessed September 15, 2023.
9 U.S. Department of Agriculture, National Agricultural Statistics Service, 2022 State Agriculture Overview, Mississippi.
10 Wallenfeldt, Jeff, David G. Sansing, and John N. Burrus, Mississippi, State, United States, Encyclopedia Britannica, accessed September 15, 2023.
11 U.S. Bureau of Economic Analysis, Interactive Data, Regional Data, GDP and Personal Income, Annual Gross Domestic Product (GDP) by State, SAGDP2 GDP in current dollars, SAGDP2N, Gross domestic product (GDP) by state, Mississippi, All statistics in table, 2021.
12 U.S. EIA, State Energy Data System, Table C10, Total Energy Consumption Estimates, Real Gross Domestic Product (GDP), Energy Consumption Estimates per Real Dollar of GDP, Ranked by State, 2021.
13 U.S. EIA, State Energy Data System, Table C1, Energy Consumption Overview: Estimates by Energy Source and End-Use Sector, 2021.
14 U.S. EIA, Electricity Data Browser, Retail Electricity Sales, Mississippi Monthly, January 2001 through June 2023.
15 U.S. EIA, State Energy Data System, Table C14, Total Energy Consumption Estimates per Capita by End-Use Sector, Ranked by State, 2021.
16 U.S. EIA, State Energy Data System, Table P3, Total Primary Energy Production and Total Energy Consumption Estimates in Trillion Btu, 2021.
17 U.S. EIA, Crude Oil Production, Annual, Thousand Barrels, 2017-22.
18 U.S. EIA, Crude Oil Proved Reserves, Reserves Changes, and Production, Proved Reserves as of 12/31, Annual, 2016-21.
19 Mississippi State Oil and Gas Board, Oil and Gas Map of Mississippi, accessed September 18, 2023.
20 U.S. EIA, U.S. Energy Atlas, All Energy Infrastructure and Resources, Mississippi, accessed September 18, 2023.
21 U.S. EIA, Mississippi Field Production of Crude Oil (Thousand Barrels), 1981-2022.
22 Mississippi Oil & Gas Board, Annual Production Charts, Oil Production, 1951-2021.
23 U.S. EIA, State Energy Data System, Table PT1, Primary Energy Production Estimates in Physical Units, Mississippi, 1960-2021.
24 Mississippi Encyclopedia, Oil and Gas Industry, accessed September 18, 2023.
25 U.S. EIA, Refinery Capacity Report 2023 (June 21, 2023), Table 1, Number and Capacity of Operable Petroleum Refineries by PAD District and State as of January 1, 2023; Table 3, Capacity of Operable Petroleum Refineries by State as of January 1, 2023.
26 Chevron, Chevron Pascagoula 2022 Refinery Facts (June 2022).
27 Ergon, Refining & Marketing, Ergon Refining Inc., accessed September 18, 2023.
28 Hunt Refining Company, Refining Operations, Sandersville Refinery, accessed September 18, 2023.
29 U.S. EIA, Refinery Capacity Report 2023 (June 21, 2023), Table 3, Capacity of Operable Petroleum Refineries by State as of January 1, 2023.
30 Colonial Pipeline Company, System Map, accessed September 18, 2023.
31 Kinder Morgan, Products Pipelines, Southeast Operations, Products (SE) Pipe Line Corporation, accessed September 18, 2023.
32 Kinder Morgan, Form 10-K, For the fiscal years ended December 31, 2020, Products Pipeline, Southeast Refined Products, PPL Pipeline, p. 10.
33 U.S. EIA, State Energy Data System, Table C1, Energy Consumption Overview: Estimates by Energy Source and End-Use Sector, 2021.
34 U.S. EIA, State Energy Data System, Table C2, Energy Consumption Estimates for Selected Energy Sources in Physical Units, 2021.
35 American Petroleum Institute, U.S. Gasoline Requirements (January 2018).
36 U.S. EIA, "Almost all U.S. gasoline is blended with 10% ethanol," Today in Energy (May 4, 2016).
37 U.S. EIA, Table E20, Motor Gasoline Price and Expenditure Estimates, Ranked by State, 2021.
38 U.S. Census Bureau, House Heating Fuel, Table B25040, 2022 ACS 1-Year Estimates Detailed Tables, United States, Mississippi.
39 U.S. EIA, Natural Gas Reserves Summary as of Dec. 31, Dry Natural Gas, Annual, 2016-21.
40 U.S. EIA, Natural Gas Gross Withdrawals and Production, Marketed Production, Annual, 2017-22.
41 U.S. EIA, Mississippi Natural Gas Marketed Production, Annual, 1967-2021.
42 Mississippi State Oil and Gas Board, Oil and Gas Map of Mississippi, accessed September 19, 2023.
43 U.S. EIA, International and Interstate Movements of Natural Gas by State, Mississippi, 2016-22.
44 U.S. EIA, Natural Gas Annual 2021 (September 30, 2022), Table 13, Underground natural gas storage capacity by state, December 31, 2021.
45 U.S. EIA, U.S. Energy Atlas, All Energy Infrastructure and Resources, Mississippi, accessed September 19, 2023.
46 Enterprise Products Partners L.P., Form 10-K for fiscal year ended December 31, 2022, Natural Gas Processing Facilities Table, Pascagoula, p. 5.
47 Kinder Morgan, Gulf LNG - Existing Import Terminal, accessed September 19, 2022.
48 Federal Energy Regulatory Commission, North American LNG Import Terminals Existing (updated September 5, 2023).
49 "DOE approves LNG exports from Gulf LNG project in Mississippi," WorkBoat (August 1, 2019).
50 Kinder Morgan, Gulf LNG Liquefaction Project, accessed September 19, 2023.
51 Weber, Harry, "Kinder Morgan content with keeping liquefaction footprint small for now," S&P Global Platts (January 29, 2020).
52 Federal Energy Regulatory Commission, North American LNG Export Terminals Approved, Not Yet Built, updated September 12, 2023.
53 U.S. EIA, Natural Gas Consumption by End Use, Mississippi, Annual, 2017-22.
54 U.S. EIA, Mississippi Natural Gas Deliveries to Electric Power Consumers (Million Cubic Feet), 1997-2022.
55 U.S. Census Bureau, House Heating Fuel, Table B25040, 2022 ACS 1-Year Estimates Detailed Tables, Mississippi.
56 U.S. EIA, Annual Coal Report 2022 (October 3, 2023), Table 15, Recoverable Coal Reserves at Producing Mines, Estimated Recoverable Reserves, and Demonstrated Reserve Base by Mining Method, 2022.
57 U.S. EIA, Annual Coal Report 2022 (October 3, 2023), Table 6, Coal Production and Number of Mines by State and Coal Rank, 2022.
58 U.S. EIA, Energy Explained, Coal Explained, Types of Coal, Lignite, updated October 19, 2022.
59 PurEnergy, Choctaw Generation LP, Red Hills Power Plant, accessed September 20, 2023.
60 Southern Company, "Southern Company and Mississippi Power Announce Suspension of Gasification Operations at Kemper," Press Release (June 28, 2017).
61 Amy, Jeff, "Utility faces federal investigation over failed $7.5 billion Kemper power plant," Associated Press (May 1, 2019).
62 Brock, Jim, "Kemper Coal Operation to Cut 75 Jobs," The Meridian Star (August 9, 2017).
63 NACCO Industries, Inc., Form 8-K filing with the U.S. Securities and Exchange Commission (February 8, 2018).
64 U.S. EIA, Annual Coal Distribution Report 2022 (October 3, 2023), Domestic distribution of U.S. coal by destination State, consumer, destination and method of transportation, Mississippi, Table DS-20, 2022.
65 U.S. EIA, Preliminary Monthly Electric Generator Inventory (based on Form EIA-860M as a supplement to Form EIA-860), Inventory of Operating Generators as of August 2023, Plant State: Mississippi, Technology: Conventional Steam Coal.
66 U.S. EIA, Electricity Data Browser, Net Generation for All Sectors, Annual, Mississippi, 2001-22.
67 U.S. EIA, Mississippi Electricity Profile 2021, Table 2A, Ten largest plants by capacity.
68 Entergy, Grand Gulf Nuclear Station, accessed September 20, 2023.
69 U.S. EIA, Nuclear Reactor, State, and Net Capacity (September 2021).
70 U.S. EIA, Electricity Data Browser, Net Generation for All Sectors, Annual, Mississippi, 2001-22.
71 U.S. EIA, Electricity Data Browser, Net Generation for All Sectors, Annual, Mississippi, 2001-22.
72 U.S. EIA, Electricity Data Browser, Net Generation for All Sectors, Annual, Mississippi, 2001-22.
73 U.S. EIA, Mississippi Electricity Profile 2021, Table 10, Supply and disposition of electricity, 1990 through 2021.
74 U.S. EIA, Electricity Data Browser, Retail sales of electricity (million kilowatthours), Annual, Mississippi 2001-22.
75 Mississippi State University, Department of Geosciences, Office of the Mississippi State Climatologist, Mississippi Climate, accessed September 20, 2023.
76 U.S. EIA, Residential Energy Consumption Survey (RECS), 2020 RECS Survey Data, State Data, Housing characteristics, Highlights for air conditioning in U.S. homes by state, 2020.
77 U.S. Census Bureau, House Heating Fuel, Table B25040, 2022 ACS 1-Year Estimates Detailed Tables, Mississippi.
78 U.S. EIA, Table C17, Electricity Retail Sales, Total and Residential, Total and per Capita, Ranked by State, 2021.
79 U.S. EIA, Electricity Data Browser, Net Generation for All Sectors, Annual, Mississippi, 2001-22.
80 U.S. Department of Energy, Energy Efficiency & Renewable Energy, Benefits of Biofuel Production and Use in Mississippi, September 2015.
81 Mississippi Department of Agriculture and Commerce, Mississippi Timber, accessed September 21, 2023.
82 U.S. EIA, Monthly Densified Biomass Fuel Report (October 2, 2023), Table 1, Densified biomass fuel manufacturing facilities in the United States by state, region, and capacity, July 2023.
83 U.S. EIA, Electricity Data Browser, Net Generation for All Sectors, Annual, Mississippi, 2001-22.
84 Mississippi Power, About Energy, Solar Power, accessed September 21, 2023.
85 U.S. EIA, Preliminary Monthly Electric Generator Inventory (based on Form EIA-860M as a supplement to Form EIA-860), Inventory of Operating Generators as of August 2023, Plant State: Mississippi, Technology: Solar Photovoltaic; Inventory of Planned Generators as of August 2023, Plant State: Mississippi, Technology: Solar Photovoltaic.
86 U.S. Department of Energy, Energy Efficiency and Renewable Energy, WINDExchange, Wind Energy in Mississippi, Maps & Data, accessed September 21, 2023.
87 U.S. EIA, Electricity Data Browser, Net Generation for All Sectors, Annual, Mississippi, 2001-22.
88 Mississippi Public Service Commission, "Mississippi Public Service Commission Approves State's First Wind Turbine Facility," Press Release (June 9, 2021).
89 AES Corporation, Delta Wind, accessed September 21, 2023.
90 Proctor, Darrell, "Amazon, AES Partner on First Utility-Scale Wind Farm in Mississippi," Power Magazine (July 7, 2023).
91 U.S. EIA, Preliminary Monthly Electric Generator Inventory (based on Form EIA-860M as a supplement to Form EIA-860), Inventory of Planned Generators as of August 2023, Plant State: Mississippi, Technology: Onshore Wind Turbine.
92 U.S. Department of the Interior, "Interior Department to Explore Offshore Wind Potential in the Gulf of Mexico," Press Release (June 8, 2021).
93 U.S. Department of the Interior, "BOEM Designates Two Wind Energy Areas in Gulf of Mexico Press Release," (October 31, 2022).
94 U.S. Department of the Interior, "Biden-Harris Administration Announces First Ever Offshore Wind Lease Sale in the Gulf of Mexico," Press Release (July 20, 2023).
95 National Hydropower Association, Mississippi, Non-Powered Dams, accessed September 21, 2023.
96 U.S. EIA, Electricity Data Browser, Net Generation for All Sectors, Annual, Mississippi, 2001-22.
97 U.S. EIA, Hydropower Explained, Where hydropower is generated, updated April 30, 2023.
98 U.S. EIA, Renewable Energy Explained, Portfolio Standards, updated November 30, 2022.
99 NC Clean Energy Technology Center, DSIRE, Mississippi, Net Metering, updated February 10, 2023.
100 Penrod, Emma, "New Mississippi rule requires utilities to pay low-income customers up front for solar installations," Utility Dive (July 14, 2022).
101 U.S. EIA, Electric Power Monthly (June 2023), Table 6.2.B.
102 U.S. EIA, U.S. Biodiesel Plant Production Capacity, (August 7, 2023), Detailed annual production capacity by plant is available in XLS format.
103 U.S. EIA, State Energy Data System, Table F26, Biodiesel Consumption Estimates, 2021.
104 U.S. EIA, U.S. Fuel Ethanol Plant Production Capacity (August 7, 2023), Detailed annual production capacity by plant is available in XLS.
105 U.S. EIA, State Energy Data System, Table F25, Fuel ethanol consumption estimates, 2021.
Other Resources
Energy-Related Regions and Organizations
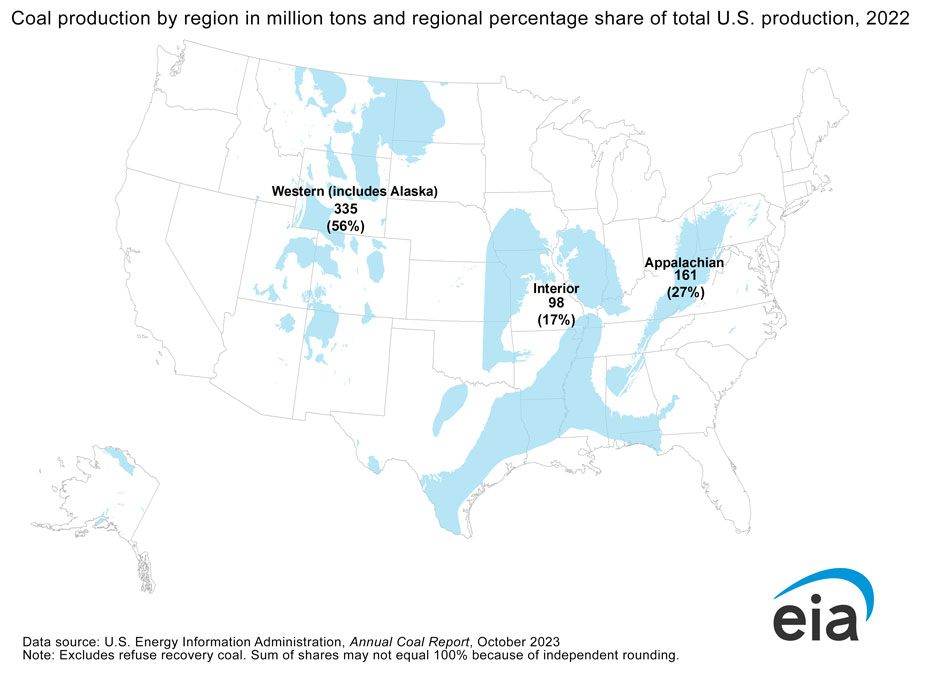
- Coal Region: Interior
- Petroleum Administration for Defense District (PADD): 3
- North American Electric Reliability Corporation (NERC) ERO Enterprise: Regional Entities: SERC Reliability Corporation (SERC)
Other Websites
- Mississippi Public Service Commission
- Mississippi Development Authority, Mississippi Forestry, Energy and Chemical Industries
- Mississippi State Oil and Gas Board
- Mississippi Department of Human Resources, Division of Community Services
- Mississipppi Energy Institute
- Mississippi Department of Environmental Quality, Office of Geology
- Mississippi Development Authority, Incentives, Energy
- Mississippi Department of Transportation, Mississippi's Electric Vehicle (EV) Infrastructure Program
- EIA Mississippi Flickr Album
- EIA Gulf of Mexico Fact Sheet
- Alternative Fuels Data Center, Federal and State Laws and Incentives
- Benefits.Gov, Housing and Public Utilities
- NC Clean Energy Technology Center, Database of State Incentives for Renewables and Efficiency (DSIRE)
- National Association of Regulatory Utility Commissioners (NARUC)
- National Association of State Energy Officials (NASEO)
- National Conference of State Legislatures (NCSL), Research and Policy
- National Renewable Energy Laboratory (NREL), Geospatial Data Science Data and Tools
- U.S. Geological Survey (USGS), Publications
- Interstate Oil and Gas Compact Commission
- Southern States Energy Board
- U.S. Department of the Interior, Bureau of Ocean Energy Management
- Tennessee Valley Authority
- Southeastern Power Administration
- U.S. Department of Health and Human Services, Administration for Children and Families, Office of Community Services, Low Income Home Energy Assistance Program (LIHEAP)
- U.S. Geological Survey, Maps
- Lawrence Livermore National Laboratory, Energy Flow Charts
- National Renewable Energy Laboratory, State and Local Planning for Energy (SLOPE)
- EIA Status of U.S. Nuclear Outages
- EIA Natural Gas Storage Dashboard
- EIA Energy Disruptions
- U.S. Department of Agriculture (USDA), Rural Development, Energy Programs