Alaska Quick Facts
- Alaska's proved crude oil reserves of 3.2 billion barrels are the fourth largest of any state. However, many of Alaska's oil fields are mature, and in 2022 the state's oil production averaged 437,000 barrels per day, the lowest level since 1976.
- Alaska ranks fourth in the nation in natural gas gross withdrawals, most of which are reinjected into oil fields to help maintain crude oil production rates.
- Many rural communities in Alaska rely primarily on diesel-fueled electric generators for power, and Alaska ranks second only to Hawaii in the share of its total electricity--14% in 2022--generated from petroleum.
- Alaska's per capita energy consumption is the second highest in the nation in part because of the state's small population, harsh winters, and energy-intensive industries.
- In 2022, Alaska generated about 33% of its total electricity from renewable energy sources. The state has a non-binding goal to generate 50% of its electricity from renewable and alternative energy sources by 2025.
Last Updated: March 16, 2023
Data
Last Update: March 21, 2024 | Next Update: April 18, 2024
| Prices | |||||
|---|---|---|---|---|---|
| Petroleum | Alaska | U.S. Average | Period | find more | |
| Domestic Crude Oil First Purchase | $ 72.39 /barrel | $ 71.00 /barrel | Dec-23 | ||
| Natural Gas | Alaska | U.S. Average | Period | find more | |
| City Gate | $ 8.32 /thousand cu ft | $ 4.39 /thousand cu ft | Dec-23 | find more | |
| Residential | $ 10.89 /thousand cu ft | $ 12.94 /thousand cu ft | Dec-23 | find more | |
| Coal | Alaska | U.S. Average | Period | find more | |
| Average Sales Price | W | $ 54.46 /short ton | 2022 | ||
| Delivered to Electric Power Sector | $ 4.42 /million Btu | $ 2.48 /million Btu | Dec-23 | ||
| Electricity | Alaska | U.S. Average | Period | find more | |
| Residential | 24.70 cents/kWh | 15.73 cents/kWh | Dec-23 | find more | |
| Commercial | 21.98 cents/kWh | 12.39 cents/kWh | Dec-23 | find more | |
| Industrial | 20.64 cents/kWh | 7.66 cents/kWh | Dec-23 | find more | |
| Reserves | |||||
|---|---|---|---|---|---|
| Reserves | Alaska | Share of U.S. | Period | find more | |
| Crude Oil (as of Dec. 31) | 3,127 million barrels | 7.6% | 2021 | find more | |
| Expected Future Production of Dry Natural Gas (as of Dec. 31) | 98,841 billion cu ft | 16.8% | 2021 | find more | |
| Expected Future Production of Natural Gas Plant Liquids | 230 million barrels | 0.9% | 2021 | find more | |
| Recoverable Coal at Producing Mines | 45 million short tons | 0.4% | 2022 | find more | |
| Rotary Rigs & Wells | Alaska | Share of U.S. | Period | find more | |
| Natural Gas Producing Wells | 827 wells | 0.2% | 2020 | find more | |
| Capacity | Alaska | Share of U.S. | Period | ||
| Crude Oil Refinery Capacity (as of Jan. 1) | 165,500 barrels/calendar day | 0.9% | 2023 | ||
| Electric Power Industry Net Summer Capacity | 2,829 MW | 0.2% | Dec-23 | ||
| Supply & Distribution | |||||
|---|---|---|---|---|---|
| Production | Alaska | Share of U.S. | Period | find more | |
| Total Energy | 1,340 trillion Btu | 1.4% | 2021 | find more | |
| Crude Oil | 433 thousand barrels per day | 3.3% | Dec-23 | find more | |
| Natural Gas - Marketed | 373,141 million cu ft | 0.9% | 2022 | find more | |
| Coal | 1,014 thousand short tons | 0.2% | 2022 | find more | |
| Total Utility-Scale Net Electricity Generation | Alaska | Share of U.S. | Period | find more | |
| Total Net Electricity Generation | 559 thousand MWh | 0.2% | Dec-23 | ||
| Utility-Scale Net Electricity Generation (share of total) | Alaska | U.S. Average | Period | ||
| Petroleum-Fired | 14.3 % | 0.3 % | Dec-23 | find more | |
| Natural Gas-Fired | 54.2 % | 42.2 % | Dec-23 | find more | |
| Coal-Fired | 8.2 % | 16.2 % | Dec-23 | find more | |
| Nuclear | 0.0 % | 19.9 % | Dec-23 | find more | |
| Renewables | 23.4 % | 20.9 % | Dec-23 | ||
| Stocks | Alaska | Share of U.S. | Period | find more | |
| Motor Gasoline (Excludes Pipelines) | 280 thousand barrels | 2.0% | Dec-23 | ||
| Distillate Fuel Oil (Excludes Pipelines) | 1,149 thousand barrels | 1.1% | Dec-23 | find more | |
| Natural Gas in Underground Storage | 44,140 million cu ft | 0.6% | Dec-23 | find more | |
| Petroleum Stocks at Electric Power Producers | NM | NM | Dec-23 | find more | |
| Coal Stocks at Electric Power Producers | 0 thousand tons | 0.0% | Dec-23 | find more | |
| Fueling Stations | Alaska | Share of U.S. | Period | ||
| Motor Gasoline | 182 stations | 0.2% | 2021 | ||
| Propane | 1 stations | * | Feb-24 | ||
| Electric Vehicle Charging Locations | 62 stations | 0.1% | Feb-24 | ||
| E85 | 0 stations | 0.0% | Feb-24 | ||
| Biodiesel, Compressed Natural Gas, and Other Alternative Fuels | 0 stations | 0.0% | Feb-24 | ||
| Consumption & Expenditures | |||||
|---|---|---|---|---|---|
| Summary | Alaska | U.S. Rank | Period | ||
| Total Consumption | 684 trillion Btu | 40 | 2021 | find more | |
| Total Consumption per Capita | 932 million Btu | 1 | 2021 | find more | |
| Total Expenditures | $ 6,395 million | 40 | 2021 | find more | |
| Total Expenditures per Capita | $ 8,711 | 1 | 2021 | find more | |
| by End-Use Sector | Alaska | Share of U.S. | Period | ||
| Consumption | |||||
| » Residential | 55 trillion Btu | 0.3% | 2021 | find more | |
| » Commercial | 61 trillion Btu | 0.4% | 2021 | find more | |
| » Industrial | 378 trillion Btu | 1.2% | 2021 | find more | |
| » Transportation | 190 trillion Btu | 0.7% | 2021 | find more | |
| Expenditures | |||||
| » Residential | $ 906 million | 0.3% | 2021 | find more | |
| » Commercial | $ 924 million | 0.5% | 2021 | find more | |
| » Industrial | $ 802 million | 0.3% | 2021 | find more | |
| » Transportation | $ 3,764 million | 0.6% | 2021 | find more | |
| by Source | Alaska | Share of U.S. | Period | ||
| Consumption | |||||
| » Petroleum | 45 million barrels | 0.6% | 2021 | find more | |
| » Natural Gas | 445 billion cu ft | 1.4% | 2022 | find more | |
| » Coal | 1,239 thousand short tons | 0.2% | 2022 | find more | |
| Expenditures | |||||
| » Petroleum | $ 4,769 million | 0.6% | 2021 | find more | |
| » Natural Gas | $ 905 million | 0.3% | 2022 | find more | |
| » Coal | $ 86 million | 0.3% | 2022 | find more | |
| Consumption for Electricity Generation | Alaska | Share of U.S. | Period | find more | |
| Petroleum | 148 thousand barrels | 8.3% | Dec-23 | find more | |
| Natural Gas | 2,887 million cu ft | 0.3% | Dec-23 | find more | |
| Coal | 32 thousand tons | 0.1% | Dec-23 | find more | |
| Energy Source Used for Home Heating (share of households) | Alaska | U.S. Average | Period | ||
| Natural Gas | 47.1 % | 46.2 % | 2022 | ||
| Fuel Oil | 28.1 % | 3.9 % | 2022 | ||
| Electricity | 15.3 % | 41.3 % | 2022 | ||
| Propane | 2.8 % | 5.0 % | 2022 | ||
| Other/None | 6.8 % | 3.5 % | 2022 | ||
| Environment | |||||
|---|---|---|---|---|---|
| Renewable Energy Capacity | Alaska | Share of U.S. | Period | find more | |
| Total Renewable Energy Electricity Net Summer Capacity | 549 MW | 0.2% | Dec-23 | ||
| Ethanol Plant Nameplate Capacity | -- | -- | 2023 | ||
| Renewable Energy Production | Alaska | Share of U.S. | Period | find more | |
| Utility-Scale Hydroelectric Net Electricity Generation | 116 thousand MWh | 0.6% | Dec-23 | ||
| Utility-Scale Solar, Wind, and Geothermal Net Electricity Generation | 11 thousand MWh | * | Dec-23 | ||
| Utility-Scale Biomass Net Electricity Generation | 3 thousand MWh | 0.1% | Dec-23 | ||
| Small-Scale Solar Photovoltaic Generation | 0 thousand MWh | 0.0% | Dec-23 | ||
| Fuel Ethanol Production | 0 thousand barrels | 0.0% | 2021 | ||
| Renewable Energy Consumption | Alaska | U.S. Rank | Period | find more | |
| Renewable Energy Consumption as a Share of State Total | 3.6 % | 48 | 2021 | ||
| Fuel Ethanol Consumption | 0 thousand barrels | 51 | 2021 | ||
| Total Emissions | Alaska | Share of U.S. | Period | find more | |
| Carbon Dioxide | 38.9 million metric tons | 0.8% | 2021 | ||
| Electric Power Industry Emissions | Alaska | Share of U.S. | Period | find more | |
| Carbon Dioxide | 3,592 thousand metric tons | 0.2% | 2022 | ||
| Sulfur Dioxide | 2 thousand metric tons | 0.2% | 2022 | ||
| Nitrogen Oxide | 18 thousand metric tons | 1.5% | 2022 | ||
Analysis
Last Updated: March 16, 2023
Overview
Alaska, the largest U.S. state, is one-fifth the size of the Lower 48 states, and, with its Aleutian Island chain, is as wide as the Lower 48 states from east to west.1 It is the only U.S. state with land north of the Arctic Circle, and it has the highest mountains and longest coastline of any state.2 Alaska's winters are frequently severe, but its climate varies significantly from north to south and from winter to summer, particularly in the interior of the state, where temperatures range from -30°F in winter to near 100°F in summer.3 Large areas of Alaska remain uninhabited. It has the third-smallest population of the U.S. states and is the least densely populated state at about 1 person per square mile.4 Nearly half of Alaskans live in the cities of Anchorage, Juneau, and Fairbanks.5
The oil and natural gas industries are a key part of Alaska's energy-intensive economy, and the state ranks third in the nation with the highest amount of energy consumption per dollar of GDP.6,7,8 The area of Alaska known as the North Slope contains 6 of the 100 largest oil fields in the United States and 1 of the 100 largest natural gas fields. Alaska's Prudhoe Bay field is among the 10 largest oil fields in the nation.9 Alaska does not have a state sales tax or a personal income tax, as revenues from Alaska's oil and gas industry fund most of the state government.10 Since 1982, every eligible state resident receives an annual dividend that is based on the value of oil royalty revenue in the Alaska Permanent Fund. The 2022 dividend was a record $3,284, nearly triple the amount from the year before.11,12
Alaska’s energy demand per capita is the second-highest in the nation.
Alaska has other substantial energy resources. Its recoverable coal reserves rank 13th among the states.13 Alaska's many rivers offer some of the best hydroelectric power potential in the nation.14 Large swaths of the Alaskan coastline have significant wind energy resources, and the state's many volcanic areas offer geothermal energy potential.15,16 Alaska's total energy demand is among the lowest one-fourth of the states.17 However, with its harsh winters, energy-intensive oil and natural gas industries, and small population, the state's per capita total energy consumption is the second-highest in the nation, after Louisiana. Alaska's industrial sector accounts for almost three-fifths of the state's energy use, followed by the transportation sector at one-fourth, the commercial sector at about one-tenth, and the residential sector at about one-twelfth. Alaska has had the nation's highest transportation sector per capita energy use in every year since 1969.18,19
Petroleum
Alaska's proved crude oil reserves—about 3.2 billion barrels at the beginning of 2022—are the fourth-largest in the nation.20 Alaska was among the top five oil-producing states for many years. The state moved up from sixth place in 2020 to fourth in 2021 and 2022, even though its annual oil production was the lowest in more than 45 years at 437,000 barrels per day. The state's oil output peaked at 2 million barrels per day in 1988, and has declined steadily since then as the state's oil fields matured.21,22 In recent decades, Alaska experienced relatively warmer temperatures, and for longer periods of time. Warmer temperatures reduce the amount of time energy companies can explore for onshore oil, because ice roads and drilling pads are used only during the coldest months of the year, when the frozen ground is less damaged by heavy equipment. Conversely, the warmer temperatures reduce floating ice packs, which makes it easier to ship production facilities and equipment to the North Slope oil fields.23,24
Large areas of the state remain unexplored for oil. Although the Arctic National Wildlife Refuge (ANWR), located in northeastern Alaska was opened for drilling and exploration in 2017, the Biden administration suspended leases in 2021 and ordered a comprehensive review of the environmental impact of oil exploration in ANWR. 25,26,27,28 The U.S. Geological Survey estimates the ANWR coastal plain holds 10.4 billion barrels of crude oil.29 In January 2022, the Biden administration also reduced by one-third the area available for oil and natural gas leasing in the separate National Petroleum Reserve, located to the west of ANWR, from 18.6 million acres to 11.8 million acres.30,31 In March 2023, the U.S. Department of the Interior approved a scaled-back version of the Willow oil drilling project in part of the National Petroleum Reserve that could produce up to 180,000 barrels of crude oil per day at its peak.32
Most of Alaska's crude oil production—typically over 95%—occurs on the North Slope.33 The Trans-Alaska Pipeline System, which began operating in 1977, transports crude oil 800 miles from the frozen North Slope to the warm-water port at Valdez, on Alaska's southern coast.34 In 1988, the pipeline's oil throughput peaked at just over 2 million barrels per day. Since 2003, actual deliveries have been less than 1 million barrels per day, and averaged 483,000 barrels per day in 2022, the first year-over-year increase since 2017.35,36 Low volumes cause the oil to move more slowly in the pipeline, which results in colder oil. That creates challenges for the pipeline's operators, including the formation of ice and the buildup of wax that is in the oil on the pipeline wall. The amount of time it takes for oil to travel through the pipeline from the North Slope to the Valdez port increased from 4.5 days in 1988 to about 19 days in 2020.37,38
Most of the oil produced in Alaska is sent to refineries in Washington and California.
Tankers transport most of the oil produced in Alaska to refineries in Washington and California.39 On March 24, 1989, the Exxon Valdez tanker struck Bligh Reef and spilled 257,000 barrels of crude oil into Prince William Sound, located on Alaska's southern coast.40 The accident resulted in improvements to tanker construction, navigation technology, and crew training.41
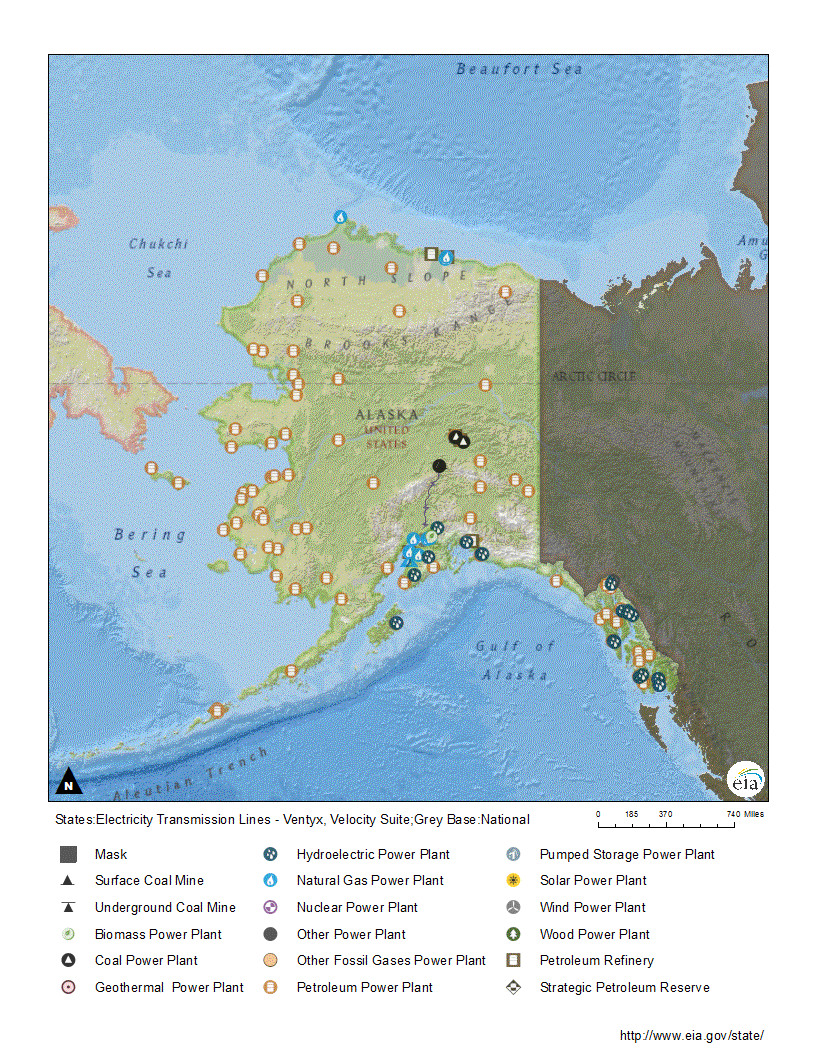
Alaska has five operating refineries, with a combined processing capacity of about 164,000 barrels of crude oil per calendar day.42 Two of the refineries, in the Prudhoe Bay region, supply fuel for crude oil drilling operations. A refinery in Kenai, southwest of Anchorage, produces most of the state's motor gasoline as well as some distillate fuel oil. Two other refineries, located in Valdez and near Fairbanks, also produce diesel and heating fuels.43,44 Alaska ranks 13th among the states with the lowest total petroleum demand, but it has the second-highest per capita petroleum consumption, after Louisiana.45 Alaska is the largest jet fuel-consuming state on a per capita basis and the fifth-largest in total jet fuel use.46,47 The state is a major fueling stop for military aircraft as well as for commercial passenger and cargo flights between the United States and Asian countries.48,49 Alaska also consumes petroleum to produce electricity. In 2022, petroleum liquids fueled 14% of the state's electricity at utility-scale power plants (1 megawatt or larger). Small diesel-fueled generators also produce electricity in many of the state's isolated communities.50,51,52 Three out of 10 state households rely on fuel oil, kerosene, or propane for heating.53
Natural gas
Most of Alaska’s natural gas withdrawals are reinjected into oil reservoirs to maintain crude oil production rates.
Alaska's proved natural gas reserves—about 100 trillion cubic feet—rank third among the states.54 Alaska's natural gas withdrawals totaled nearly 3.6 trillion cubic feet in 2022, the highest since 2005 and the fourth-largest in the nation (after Texas, Pennsylvania, and Louisiana).55 Most of the state's gas production is not brought to market. Natural gas volumes from the North Slope far exceed local demand, and there is no pipeline to transport the natural gas to consumers in the southern part of the state.56,57 Instead, operators reinject most of the state's natural gas withdrawals back into oil reservoirs to help maintain crude oil production rates.58 About 81% of Alaska's natural gas consumption occurs in the natural gas and crude oil production process. The electric power sector accounts for 6% of the state's natural gas consumption, as natural gas-fired generators provide about two-fifths of Alaska's utility-scale electricity. The residential sector accounts for 5%, as half of Alaskan households, most of which are located in the state's three biggest cities, heat with natural gas. The commercial sector accounts for 4% of the state's natural gas consumption and the industrial sector makes up 3%.59,60,61
The Alaska government created a state-owned corporation to build an 800-mile pipeline that would bring the North Slope's natural gas to international markets. As part of the pipeline project, the Alaska government also wants to build a new liquefied natural gas (LNG) export terminal near Anchorage. The terminal would receive North Slope natural gas via the pipeline that could transport up to 3.3 billion cubic feet of natural gas a day.62,63,64,65,66 In May 2020, the Federal Energy Regulatory Commission (FERC) authorized the LNG project. However, in April 2021 FERC ordered that a supplemental environmental impact study be done on the plant. The state wants one or more energy companies to take over the project, which has a price tag of nearly $39 billion.67,68,69,70,71
Alaska has an LNG liquefaction and terminal complex, located in Kenai on Cook Inlet, which began operating in 1969. Until 2012, it was the only facility in the United States authorized to export LNG produced from domestic natural gas. The terminal has the capacity to liquefy up to 200 million cubic feet of natural gas per day and it used to export LNG to Asia.72,73 However, LNG shipments declined and the terminal's owner sold the facility in early 2018. The new owners won approval from FERC in 2020 to modify the terminal so it can receive LNG imports. In August 2022, FERC approved a request from the terminal's owners for more time, until the end of December 2025, to convert the terminal to handle LNG imports.74,75,76
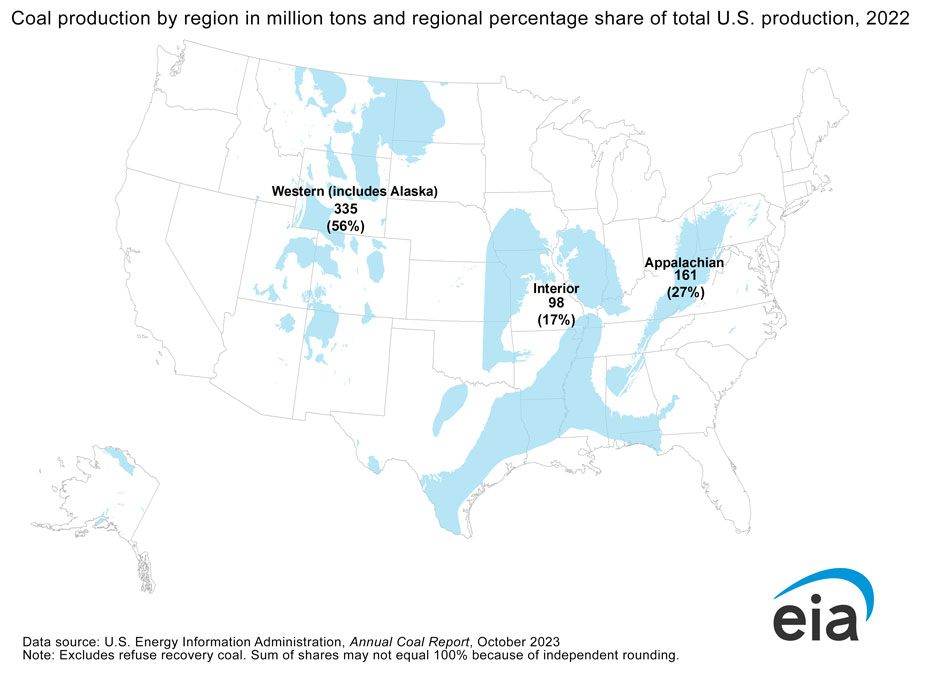
Coal
Alaska's recoverable coal reserves are estimated at 2.8 billion tons, about 1% of the U.S. total.77 Coal mines have operated in Alaska since 1855.78 Substantial deposits of bituminous coal, subbituminous coal, and lignite are found in the north, south, and central portions of the state, but most of Alaska's coal remains unmined.79,80,81,82 Alaska has one operating surface coal mine, the Usibelli mine, which produces about 1 million tons of coal per year.83,84 In 2021, none of Alaska's coal was exported. Instead, it was used in the state at coal-fired power plants and by commercial and institutional users.85 In past years, Alaska exported some of its coal to countries in Asia.86
Electricity
Alaska ranked second, after Hawaii, for the largest share of petroleum-fired electricity generation in 2022.
In 2022, natural gas fueled 42% of Alaska's total electricity net generation and hydroelectric power generated 29%. Petroleum accounted for 14%, coal fueled 12%, and other renewables—mostly wind, biomass, and solar—accounted for about 3% of Alaska's generation.87 Alaska generated the second-highest share of its electricity from petroleum after Hawaii and New York.88 In February 2020, the only coal-fired power plant built in the United States since 2014 began operating in Alaska. The plant, constructed at the University of Alaska's Fairbanks campus, has a generating capacity of 17 megawatts.89,90,91
Alaska's electricity infrastructure differs from that in the Lower 48 states because Alaskans are not linked to large, interconnected grids through transmission and distribution lines. Instead, an electric grid called the Railbelt serves an area, where about three-fourths of the state's population lives, that stretches from Fairbanks to Anchorage and down to the Kenai Peninsula. However, the Railbelt grid is isolated from the electric grids in Canada and the Lower 48 states.92 In 2020, Alaska's governor signed legislation into law to create an electric reliability organization to develop grid reliability standards among the six Railbelt utilities. In March 2022, the Railbelt utilities submitted to state regulators their proposal for the organization to manage and review improvements to the grid.93,94,95
Alaska uses less electricity than all other states except Vermont, and is among the 10 states with the lowest per capita electricity sales.96 In 2022, the commercial sector accounted for 43% of Alaska's electricity sales, followed by the residential sector at 34%, and the industrial sector at 23%.97 About one out of seven Alaskan households use electricity for their primary heating source.98 Electricity prices in the state's rural areas can be three to five times higher than the rates in the urban areas, so the state provides financial assistance to local communities to help cover the cost of electricity.99 Most of the state's rural communities do not have grid access and rely on consumer-owned electric cooperatives for their power. Many of those rural power providers use diesel-fueled electricity generators for some or all of their power supplies.100,101,102,103
Renewable energy
In 2022, hydropower supplied about 90% of Alaska’s renewable electricity.
In 2010, the Alaska legislature enacted a non-binding goal for 50% of the state's electricity to be generated from renewable and alternative energy sources by 2025.104,105 In 2022, renewable energy accounted for about 33% of Alaska's total electricity generation. Hydropower provided about nine-tenths of that renewable electricity, with smaller amounts from wind, biomass, and solar.106 Utility-scale hydropower facilities are concentrated in southern Alaska, where there are mountainous regions with high annual rainfalls. Smaller run-of-river projects—which do not use dams—produce power in some rural communities. Alaska is also exploring tidal and ocean technologies that could supply renewable energy to coastal communities.107 Small wind and solar power generation projects are found in many of the state's remote communities to reduce the use of petroleum products, which have high delivery costs, to generate electricity.108
Wind energy resources are abundant along Alaska's coastline. In 2022, wind power supplied about 7% of Alaska's renewable generation from about 60 megawatts of utility-scale wind power generating capacity, located mostly along the state's southern and western coasts and on the Railbelt grid.109,110,111,112,113 Increasing numbers of small wind energy facilities, including some wind-diesel hybrid systems, provide power to rural communities throughout the state that are off the main grid.114
Biomass fuels, which include wood, sawmill wastes, fish byproducts, and municipal waste, generated 2% of Alaska's renewable power in 2022.115 In 2010, the state's first large-scale biodiesel plant opened. It can produce 1,000 gallons of biodiesel per day using waste vegetable oil gathered from local restaurants.116,117,118 Wood is an important renewable energy resource for Alaskans, with more than 100,000 cords burned every year for residential space heating in one out of every 25 Alaskan households.119,120 The state also has one wood pellet manufacturer, located near Fairbanks, that has a production capacity of 30,000 tons per year.121 Alaskan fishmeal plants produce about 8 million gallons of fish oil as a byproduct annually, much of which is used as boiler fuel for drying the fishmeal or exported for livestock feed.122
Despite Alaska's high latitudes and long winter nights, solar energy plays a role in off-grid applications, especially during summer in remote locations. Solar thermal technologies for water and building heating and customer-sited, small-scale (less than 1 megawatt capacity) solar photovoltaic panels are used for electricity generation throughout the state.123,124,125 By early 2022, there were 2,000 small-scale solar panel systems connected to the Railbelt grid alone.126 Alaska's largest solar farm, with 1 megawatt of capacity located in Kotzebue along the coast in northwest Alaska, came online in mid-2020.127 Total generating capacity of small-scale solar panel generating systems in Alaska is about 20 times greater than the capacity from utility-scale solar installations at commercial sites.128 In 2021, small-scale solar generating systems produced 12,000 megawatthours of electricity. Alaska's use of small-scale solar continues to grow and generation increased to 16,000 megawatthours and to almost 1% of the state's total renewable generation in 2022.129
Alaska has geothermal potential, but little commercial development.130,131,132 The state's only geothermal power plant, the 400-kilowatt geothermal power facility at Chena Hot Springs, was built in 2006.133,134 A new 36-megawatt geothermal power plant is planned on the slopes of a volcano near the fishing town of Unalaska on one of the Aleutian Islands and is expected to come online in late 2023.135,136 A major challenge in developing more geothermal power projects in the state is that much of Alaska's geothermal resources are located in remote areas, far from population centers that would use the electricity generated.137
Energy on tribal lands
Alaska has more territory held as tribal lands—over 44 million acres or nearly 11% of Alaska's total land area—than any other state.138 A total of 12 regional native corporations encompassing 229 tribal groups own almost all of Alaska's tribal land.139 The Alaska Native Claims Settlement Act, passed by the U.S. Congress in 1971, divided Alaska into 12 geographic regions of common heritage and interests. Under the Act, tribal lands do not have the sovereign status of reservations, as most of the Native American reservations do in the Lower 48 states. Instead, Native Alaskans corporately own the land, allowing each native corporation to benefit from resources on their lands. In 1975, a 13th regional corporation was created to represent the interests of Native Alaskans who live in the Lower 48 States.140,141 The Metlakatla Indian Community on the Annette Island Reserve at the bottom tip of Alaska's southeastern panhandle, about 20 miles from the Canadian border, is the only native reservation in Alaska. The reservation was created by Congress in 1891. The Metlakatla community voted not to be part of the 1971 Alaska Native Claims Settlement Act and chose to retain rights to their land.142 The native corporations hold most subsurface mineral rights on native lands and are among the largest private businesses in the state.143
Alaska's tribal lands contain oil and natural gas resources on the North Slope and along the southern coast, as well as Alaska's largest bituminous coal deposit, which is also located on the North Slope. The state's tribal lands also have renewable energy resources.144,145,146,147 Native corporations control almost one-fourth of Alaska's 129 million acres of forested land, which provides the tribes with vast biomass resources. More than half of the timber harvested in Alaska comes from native corporations' land.148 The native corporations share about 70% of the revenue earned from timber, oil, natural gas, coal, minerals, and other natural resources in proportion to their native populations. A significant portion of each corporation's revenue is then redistributed to village corporations within each region.149 The corporations have many business subsidiaries that involve Native Alaskans in the development of their energy resources, including oil and natural gas field services, oil refining, and real estate and financial services. One corporation manages a utility-scale wind farm and is a shareholder in Alaska's first underground natural gas storage facility, which is the second-largest of the state's five underground natural gas storage sites and it can hold 11 billion cubic feet of natural gas.150,151 Another native corporation controls the only Alaskan-owned petroleum refining and fuel marketing operation, which runs two refineries in the state.152
Several energy projects undertaken by Alaska Native corporations or on tribal lands have received federal funding in recent years, many of which reduced generation fueled by high-cost diesel fuel. In 2022, the U.S. Department of Energy (DOE) awarded $1.7 million to fund a 65-kilowatt geothermal-fueled power plant to provide electricity and heat to 18 tribal buildings at Pilgrim Hot Springs in remote northwestern Alaska.153 A separate $674,000 grant from DOE in 2022 helped pay for 200 kilowatts of solar photovoltaic generating capacity to provide supplemental power to the 440 residents of the Yup'ik Eskimo community located in Kongiganak on the southwestern coast of Alaska.154 In 2021, DOE awarded an $856,000 grant to a tribal-owned utility in the Native village of Kipnuk near the Bering Sea in southwestern Alaska to integrate a 500-kilowatt battery storage system into the village's wind-powered and diesel-fueled grid. The battery storage system will displace more than 34,000 gallons of diesel fuel used annually by the utility to generate electricity.155
Endnotes
1 State of Alaska, Alaska Kids' Corner, Geography of Alaska, accessed February 18, 2023.
2 Fly Alaska, Interesting Geographical Alaska Facts, accessed February 18, 2023.
3 Travel Alaska, Alaska Weather, accessed February 18, 2023.
4 World Population Review, U.S. States Ranked by Population 2023, accessed February 18, 2023.
5 Alaska Department of Labor and Workforce Development, Alaska Population Overview, 2019 Estimates, Population Centers, p. 4.
6 State of Alaska, Alaska Kids' Corner, Economy, accessed February 18, 2023.
7 U.S. Energy Information Administration (EIA), "U.S. energy intensity has dropped by half since 1983, varying greatly by state," Today in Energy (August 3, 2021).
8 U.S. EIA, State Energy Data System, Table C10, Total Energy Consumption Estimates, Real Gross Domestic Product (GDP), Energy Consumption Estimates per Real Dollar of GDP, Ranked by State, 2020.
9 U.S. EIA, Top 100 U.S. Oil & Gas Fields (March 2015), p. 5-10.
10 Alaska Oil and Gas Association, The Role of the Oil and Gas Industry in Alaska's Economy, State Taxes and Royalties (January 2020), p. 4-5.
11 Alaska Department of Revenue, Permanent Fund Dividend, accessed February 18, 2023.
12 Turner, Jeff "2022 Permanent Fund Dividend Hits a Record $3,284," Alaska Native News (September 9, 2022).
13 U.S. EIA, Annual Coal Report 2021 (October 18, 2022), Table 15, Recoverable Coal Reserves at Producing Mines, Estimated Recoverable Reserves, and Demonstrated Reserve Base by Mining Method, 2021.
14 U.S. Department of Energy, New Stream-reach Development: A Comprehensive Assessment of Hydropower Energy Potential in the United States (April 2014), Region 19-Alaska, p. 169-172.
15 U.S. Department of Energy, Energy Efficiency and Renewable Energy, WINDExchange, Wind Energy in Alaska, Maps & Data, accessed February 18, 2023.
16 Alaska Department of Natural Resources, Geological & Geophysical Survey, Geothermal Energy, accessed February 18, 2023.
17 U.S. EIA, State Energy Data System, Table C10, Total Energy Consumption Estimates, Real Gross Domestic Product (GDP), Energy Consumption Estimates per Real Dollar of GDP, Ranked by State, 2020.
18 U.S. EIA, State Energy Data System, Table C14, Total Energy Consumption Estimates per Capita by End-Use Sector, Ranked by State, 2020.
19 U.S. EIA, "More energy is used per person for transportation in states with low population density," Today in Energy (August 31, 2020).
20 U.S. EIA, U.S. Crude Oil and Natural Gas Proved Reserves, Year-end 2021 (December 30, 2022), Table 6, Crude oil and lease condensate proved reserves, reserves changes, and production, 2021.
21 U.S. EIA, Crude Oil Production, Annual-thousand barrels per day, Alaska, 1973-2022.
22 U.S. EIA, "Oil production in Alaska reaches lowest level in more than 40 years," Today in Energy (April 26, 2021).
23 Fourth National Climate Assessment, Chapter 26: Alaska, Climate, Ice Road Transportation, and Marine Vessel Traffic, accessed February 19, 2023.
24 Koeing, Ravenna, and Elizabeth Hardball, "Climate Change Slows Oil Company Plan to Drill in the Arctic," NPR (November 21, 2018).
25 U.S. Department of the Interior, Bureau of Land Management, "Trump Administration Conducts First ANWR Coastal Plain Oil and Gas Lease Sale," Press Release (January 6, 2021).
26 U.S. Department of the Interior, Bureau of Land Management, Alaska oil and gas lease sales, 2021 Lease sales, 2021 Coastal Plain Lease Sale Bid Recap (January 6, 2021).
27 Groom, Nichola, "Biden suspends Trump-era oil and gas leases in Alaska refuge," Reuters (June 1, 2021).
28 U.S. Secretary of the Interior, Order No. 3401, June 1, 2021.
29 U.S. EIA, "Development of Alaska's ANWR would increase U.S. crude oil production after 2030," Today in Energy (June 14, 2018).
30 Bradner, Tim, "Biden rolls back Trump's oil leasing plan in petroleum reserve, reducing acreage available for exploration," Mat-Su Valley Frontiersman (January 12, 2022).
31 U.S. Department of the Interior, Bureau of Land Management, National Petroleum Reserve in Alaska, accessed February 19, 2023.
32 Dick, Jacob, "Willow Project in Alaska Inching Forward as BLM Recommends Partial Approval," Natural Gas Intelligence (February 2, 2023).
33 U.S. EIA, Crude Oil Production, Annual-thousand barrels per day, Alaska, 1973-2022.
34 Alyeska Pipeline Service Co., Trans Alaska Pipeline System (TAPS), accessed February 19, 2023.
35 Alyeska Pipeline Service Co., Historic Throughput, accessed February 19, 2023.
36 Alyeska Pipeline Service Co., Taps Throughput Total Increase Year-Over-Year for First Time Since 2017 (January 10, 2023).
37 Alyeska Pipeline Service Co., Trans Alaska Pipeline System Flow Assurance Overview (April 2021), slide 4.
38 Alyeska Pipeline Service Co., Frequently Asked Questions, How Long Does It Take to Travel from Pump Station 1 in Prudhoe Bay to Valdez?, accessed February 19, 2023.
39 U.S. EIA, "Development of Alaska's ANWR would increase U.S. crude oil production after 2030," Today in Energy (June 14, 2018).
40 Exxon Valdez Oil Spill Trustee Council, Questions and Answers about the Spill, accessed February 19, 2023.
41 Alaska Department of Environmental Conservation, Division of Spill Prevention and Response, Prevention Preparedness and Response, 30 Years after the Exxon Valdez, accessed February 19, 2023.
42 U.S. EIA, Refinery Capacity Report (June 21, 2022), Table 3, Capacity of Operable Petroleum Refineries by State as of January 1, 2022.
43 Marathon Petroleum Corp., Kenai Refinery, accessed February 19, 2023.
44 PetroStar Inc., Refining, accessed February 19, 2023.
45 U.S. EIA, State Energy Data System, Table C15, Petroleum Consumption Estimates, Total and per Capita, Ranked by State, 2020.
46 U.S. EIA, State Energy Data System, Table C8, Transportation Sector Energy Consumption Estimates, 2020.
47 U.S. Census, State Population Totals: 2010-2020, Tables, Annual Estimates of the Resident Population for the Nation and States, Annual Estimates of the Resident Population for the United States, Regions, States, the District of Columbia, and Puerto Rico: April 1, 2010 to July 1, 2019; April 1, 2020; and July 1, 2020.
48 Alaska Department of Transportation and Public Facilities, Alaska International Airport System, Welcome to the Alaska International Airport System, accessed February 19, 2023.
49 Alaska Department of Transportation and Public Facilities, Ted Stevens Anchorage International Airport, Airport Facts, accessed February 19, 2023.
50 U.S. EIA, Electricity Data Browser, Net generation from all sectors (thousand megawatthours), annual, Alaska, 2019-22.
51 U.S. Senate Committee on Energy and Natural Resources, "Murkowski Calls Attention to Alaska's Isolated Energy Systems," Press Release (July 14, 2015).
52 University of Alaska Fairbanks, Alaska Center for Energy and Power, Diesel Generator Technology Briefing, accessed February 19, 2023.
53 U.S. Census Bureau, House Heating Fuel, Table B25040, 2021 ACS 1-Year Estimates Detailed Tables, Alaska.
54 U.S. EIA, U.S. Crude Oil and Natural Gas Proved Reserves, Year-end 2021 (December 30, 2022), Table 10, Total natural gas proved reserves, reserves changes, and production, wet after lease separation, 2021.
55 U.S. EIA, Natural Gas Gross Withdrawals and Production, Gross Withdrawals, Annual-Million Cubic Feet, 1967-2022.
56 U.S. EIA, Natural Gas Gross Withdrawals and Production, Gross Withdrawals, Annual-Million Cubic Feet, 2017-22.
57 U.S. EIA, U.S. Energy Atlas, All Energy Infrastructure and Resources, Alaska, Natural Gas Pipeline, accessed February 20, 2023.
58 U.S. EIA, Natural Gas Summary, Alaska, Production, Gross Withdrawals, Repressuring, Marketed Production, 2017-22.
59 U.S. EIA, Natural Gas Consumption by End Use, Alaska, Lease Fuel, Annual, 2017-22.
60 U.S. EIA, Electricity Data Browser, Net generation for all sectors, annual, Alaska, 2019-22.
61 U.S. Census Bureau, House Heating Fuel, Table B25040, 2021 ACS 1-Year Estimates Detailed Tables, Alaska.
62 Alaska Gasline Development Corporation, Alaska LNG, Pipeline, accessed February 20, 2023.
63 Alaska Gasline Development Corporation, Alaska LNG, LNG Facility, accessed February 20, 2023.
64 Alaska Gasline Development Corporation, Alaska LNG Project Update to Healy Community Meeting, (October 27, 2022), slide 3.
65 Alaska Department of Natural Resources, Division of Oil & Gas, Pipeline Projects, Alaska LNG GTP-Mainline-LF, accessed February 20, 2023.
66 Hanton, Tegan, "A state corporation is still pushing a massive gas line plan in Alaska. Is it a pipe dream?, Alaska Public Radio (May 5, 2021).
67 Persily, Larry, "FERC approves Alaska LNG project; state still looking for a new lead sponsor," Mat-Su Valley Frontiersman (May 21, 2020).
68 "New cost estimate for AK LNG Project shaves off $5B," Alaska Journal of Commerce (June 25, 2020).
69 Poux, Sabine, "Environmental regulators to give Alaska LNG pipeline another look," KTOO (July 9, 2021).
70 Bradner, Tim, "New analysis of emissions gives Alaska new sales tool for big Alaska LNG Project," Mat-Su Valley Frontiersman (October 11, 2021).
71 Dick, Jacob, "Alaska Governor Ready to ‘Unlock' North Slope Natural Gas to Power LNG, Hydrogen Exports to Asia," Natural Gas Intelligence (January 26, 2023).
72 DiSavino, Scott, "U.S. Approves ConocoPhillips LNG Exports from Alaska," Reuters (February 9, 2016).
73 Vedala, Vijajkumar, "Andeavor acquires Kenai LNG facility in Alaska from ConocoPhillips," Reuters (February 2, 2018).
74 Poux, Sabine, "Marathon gets green light to reopen LNG plant - this time, to imports," KDLL Radio (December 21, 2020).
75 Cocklin, Jamison, "LNG Imports for Alaska's Kenai Terminal Clear Another Hurdle," Natural Gas Intelligence (January 27, 2021).
76 DiSavino, Scott, "Marathon gets more time to build LNG import project in Alaska," Reuters (August 16, 2022).
77 U.S. EIA, Annual Coal Report 2021 (October 18, 2022), Table 15, Recoverable Coal Reserves at Producing Mines, Estimated Recoverable Reserves, and Demonstrated Reserve Base by Mining Method, 2021.
78 Alaska Department of Natural Resources, Mining, Land & Water, Coal Regulatory Program, Coal Mining in Alaska, accessed February 20, 2023.
79 Flores, Romeo M., Gary D. Stricker, and Scott A. Kinney, Alaska Coal Geology, Resources, and Coalbed Methane Potential, U.S. Geological Survey, DDS-77 (2005), Abstract.
80 U.S. EIA, Annual Coal Report 2021 (October 18, 2022), Table 15, Recoverable Coal Reserves at Producing Mines, Estimated Recoverable Reserves, and Demonstrated Reserve Base by Mining Method, 2021.
81 U.S. EIA, U.S. Coalbed Methane, Map, Alaska (July 2007).
82 Flores, Romeo M., Gary D. Stricker, and Scott A. Kinney, Alaska Coal Geology, Resources, and Coalbed Methane Potential, U.S. Geological Survey, DDS-77 (2005), Introduction.
83 U.S. EIA, Annual Coal Report 2021 (October 18, 2022), Table 1, Coal Production and Number of Mines by State and Mine Type, 2021 and 2020.
84 Usibelli Coal Mine, accessed February 20, 2023.
85 U.S. EIA, Annual Coal Distribution Report 2021 (October 18, 2022), Domestic and foreign distribution of U.S. coal by origin State, Alaska, and Domestic distribution of U.S. coal by origin State, consumer, destination and method of transportation, Alaska, Table OS-2, Domestic Coal Distribution, by Origin State, 2021.
86 Usibelli Coal Mine, Energy and Economic Impact of Coal in Interior Alaska (July 2018), Overview of Usibelli Coal Mine, p. 6.
87 U.S. EIA, Electricity Data Browser, Net generation for all sectors, annual, Alaska, 2019-22.
88 U.S. EIA, Electric Power Annual 2021 (November 7, 2022), Table 3.9. Utility Scale Facility Net Generation from Petroleum Liquids.
89 Koenig, Ravenna, "In Interior Alaska, reinvestment in coal power runs counter to national trend," Alaska Public Radio (October 9, 2018).
90 University of Alaska Fairbanks, Combined Heat and Power Plant, accessed February 20, 2023.
91 U.S. EIA, Preliminary Monthly Electric Generator Inventory (based on Form EIA-860M as a supplement to Form EIA-860), Inventory of Operating Generators as of December 2022, Plant State: Select All, Technology: Conventional Steam Coal.
92 Railbelt Reliability County, History of the Railbelt Grid, accessed February 20, 2023.
Alaska Center for Energy and Power, Alaska Energy Wiki, Railbelt, accessed February 20, 2023.
93 Brehmer, Elwood, "Long-sought Railbelt utility reform becomes law," Alaska Journal of Commerce (May 12, 2020).
94 Railbelt Reliability Council, The Railbelt Reliability Council, accessed February 20, 2023.
95 Brehmer, Elwood, "Alaska electric utilities submit long-sought plan for a Railbelt grid planning group," Anchorage Daily News (March 30, 2022).
96 U.S. EIA, State Energy Data System, Table C17, Electricity Retail Sales, Total and Residential, Total and per Capita, Ranked by State, 2020.
97 U.S. EIA, Electricity Data Browser, Retail sales of electricity (million kilowatthours), 2019-22.
98 U.S. Census Bureau, House Heating Fuel, Table B25040, 2021 ACS 1-Year Estimates Detailed Tables, Alaska.
99 Alaska Energy Authority, Power Cost Equalization, April 2019.
100 U.S. Department of Energy, Office of Indian Energy Policy and Programs, Sustainable Energy Solutions for Rural Alaska (April 2016), p. 21-27.
101 Green, Nathan, Marc Mueller-Stoffels, and Erin Whitney, "An Alaska case study: Diesel generator technologies," Journal of Renewable and Sustainable Energy (December 8, 2017).
102 Alaska Energy Authority, 2021 Report to Alaskans, p. 11-15.
103 U.S. Environmental Protection Agency, Remote Areas of Alaska: Affordable and Reliable Options for Meeting Energy Needs and Reducing Emissions (September 2020), p. 1-7.
104 Alaska Energy Authority, Renewable Energy Atlas of Alaska (June 2019), Renewable Portfolio Standards, p. 20.
105 The Alaska State Legislature, Enrolled HB 306: Declaring a state energy policy, 2010.
106 U.S. EIA, Electricity Data Browser, Net generation for all sectors (thousand megawatthours), annual, Alaska, 2019-22.
107 Alaska Energy Authority, Renewable Energy Atlas of Alaska (June 2019), Ocean and River Hydrokinetic, p. 12-13.
108 U.S. Environmental Protection Agency, Remote Areas of Alaska: Affordable and Reliable Options for Meeting Energy Needs and Reducing Emissions (September 2020), p. 2-3, 7-9.
109 Alaska Energy Authority, Renewable Energy Atlas of Alaska (June 2019), Wind, p. 16-17.
110 U.S. EIA, Electricity Data Browser, Net generation for all sectors (thousand megawatthours), annual, Alaska, 2019-22.
111 U.S. EIA, Preliminary Monthly Electric Generator Inventory (based on Form EIA-860M as a supplement to Form EIA-860), Inventory of Operating Generators as of December 2022, Plant State: Alaska, Technology: Onshore Wind Turbine.
112 Alaska Energy Authority, Eva Creek Wind Turbines, accessed February 21, 2023.
113 Fire Island Wind LLC, Fire Island Wind Project, accessed February 21, 2023.
114 Alaska Energy Authority, Renewable Energy Atlas of Alaska (June 2019), Wind, p. 16-17.
115 U.S. EIA, Electricity Data Browser, Net generation for all sectors (thousand megawatthours), annual, Alaska, 2019-22.
116 Alaska Energy Authority, Fish Oil & Biodiesel, accessed February 22, 2023.
117 U.S. EIA, U.S. Biodiesel Plant Production Capacity (August 8, 2022), Detailed annual production capacity by plant is available in XLS format.
118 Pacific Biodiesel, Alaska Green Waste Solutions-Anchorage, AK, accessed February 22, 2023.
119 Alaska Energy Authority, About Biomass, accessed February 22, 2023.
120 U.S. Census Bureau, House Heating Fuel, Table B25040, 2021 ACS 1-Year Estimates Detailed Tables, Alaska.
121 U.S. EIA, Monthly Densified Biomass Fuel Report (February 15, 2023), Table 1, Densified biomass fuel manufacturing facilities in the United States by state, region, and capacity, November 2022, Download Excel file.
122 Alaska Energy Authority, Fish Oil & Biodiesel, accessed February 22, 2023.
123 Alaska Energy Authority, Renewable Energy Atlas of Alaska (June 2019), Solar, p. 14-15.
124 "Shungnak, Alaska Microgrid Offsets Costly Diesel for the Village," AltEnergyMag.com (February 7, 2023).
125 DeMarban, Alex, "Large solar array means 2 Northwest Alaska villages can turn off diesel power for hours a day," Anchorage Daily News (May 22, 2022).
126 DeMarban, Alex, "Solar power heats up in Alaska," Anchorage Daily News (May 1, 2022).
127 Kotzebue Electric Association, Solar Power, accessed February 22, 2023.
128 U.S. EIA, Electric Power Monthly (February 27, 2023), Table 6.2.B, Net Summer Capacity Using Primarily Renewable Energy Sources and by State, December 2022 and 2021 (Megawatts).
129 U.S. EIA, Electricity Data Browser, Net generation for all sectors (thousand megawatthours), annual, quarterly, monthly, Alaska, 2019-22.
130 Alaska Energy Authority, Renewable Energy Atlas of Alaska (June 2019), p. 8-9.
131 Alaska Department of Natural Resources, Division of Oil & Gas, Geothermal Program, accessed February 22, 2023.
132 Alaska Center for Energy and Power, Geothermal Resource Assessment Projects, accessed February 20, 2023.
133 Richter, Alexander, "Staying warm in Alaska - reflecting on geothermal opportunities," Think Geoenergy (October 1, 2018).
134 Richter, Alexander, "State of Alaska seeks land nomination for potential geothermal lease sale," Think Geoenergy (August 20, 2018).
135 "Construction Contract Agreement for Makushin Geothermal Project," Alaska Business (January 19, 2022).
136 Brehmer, Elwood, "Joint venture tries again to advance Unalaska geothermal energy project," Anchorage Daily News (June 17, 2021).
137 Alaska Energy Authority, Renewable Energy Atlas of Alaska (June 2019), p. 8.
138 U.S. Forest Service, Forest Service National Resource Guide to American Indian and Alaska Native Relations, FS-600 (April 1997), Appendix D: Indian Nations, p. D-3.
139 U.S. Department of the Interior, Indian Affairs, Alaska Region, Overview, accessed February 23, 2023.
140 Native American Science Curriculum, Alaska Native Land Claims & Tribal Sovereignty Issues, accessed February 23, 2023.
141 United States Government Accountability Office, Increased Use of Alaska Native Corporations' Special 8(a) Provisions Calls for Tailored Oversight (April 2006), p. 1-2, 9.
142 Alaskan-Natives.com, Metlakatla Indian Community, Annette Island Reserve, accessed February 26, 2023.
143 "The 2022 Top 49ers: Alaskan-Owned Companies Ranked by Gross Revenue," Alaska Business (October 2022).
144 National Congress of American Indians, Alaska Native Corporations, accessed February 23, 2023.
145 Flores, Romeo M., Gary D. Stricker, and Scott A. Kinney, Alaska Coal Geology, Resources, and Coalbed Methane Potential, U.S. Geological Survey, DDS-77 (2005), Northern Alaska Slope Coal Province.
146 Arctic Slope Regional Corporation, Operations, accessed February 23, 2023.
147 U.S. Department of Energy, Office of Indian Energy, Tribal Energy Atlas, accessed February 23, 2023.
148 Resource Development Council for Alaska, Alaska's Forest Industry, Facts & Economic Impact, accessed February 23, 2023.
149 Native American Science Curriculum, Alaska Native Land Claims & Tribal Sovereignty Issues, accessed February 23, 2023.
150 Cook Inlet Region, Inc., Energy and Infrastructure, accessed February 23, 2023.
151 U.S. EIA, Natural Gas Annual Respondent Query System, Alaska, October 2022.
152 Arctic Slope Regional Corporation, Operations, Petroleum Refining & Marketing, accessed February 23, 2023.
153 U.S. Department of Energy, Office of Indian Energy Policy and Programs, Tribal Energy Projects Database, Kawerak Inc - 2022 Project, accessed February 24, 2023.
154 U.S. Department of Energy, Office of Indian Energy Policy and Programs, Tribal Energy Projects Database, Puvurnaq Power Company - 2022 Project, accessed February 24, 2023.
155 U.S. Department of Energy, Office of Indian Energy Policy and Programs, Tribal Energy Projects Database, Kipnuk Light Plant - 2021 Project, Light Plant - 2021 Project, accessed February 24, 2023.
Other Resources
Energy-Related Regions and Organizations
Other Websites
- Alaska Energy Data Gateway
- Alaska Energy Authority
- Alaska Oil and Gas Conservation Commission
- Alaska Department of Health and Social Services, Division of Public Assistance, Heating Assistance Program
- Alaska Community Development Corporation, Weatherization Assistance Program
- Alaska Department of Environmental Conservation
- Alaska Department of Natural Resources, Division of Oil and Gas
- Alaska Department of Revenue, Permanent Fund Dividend
- Alaska Department of Commerce, Community and Economic Development, Division of Community and Regional Affairs, Bulk Fuel Revolving Loan Program
- U.S. Department of the Interior, Indian Affairs, Alaska Resupply Program
- U.S. Department of Agriculture, Rural Energy for America Program Energy Audit & Renewable Energy Development Assistance Grants in Alaska
- EIA Alaska Flickr Album
- University of Alaska Fairbanks, Alaska Center for Energy and Power
- Denali Commission Project Database
- Benefits.Gov, Housing and Public Utilities
- NC Clean Energy Technology Center, Database of State Incentives for Renewables and Efficiency (DSIRE)
- National Association of Regulatory Utility Commissioners (NARUC)
- National Association of State Energy Officials (NASEO)
- National Conference of State Legislatures (NCSL), Research and Policy
- National Renewable Energy Laboratory (NREL), Geospatial Data Science Data and Tools
- U.S. Geological Survey (USGS), Publications
- U.S. Geological Survey, Maps
- Interstate Oil and Gas Compact Commission
- U.S. Department of the Interior, Bureau of Ocean Energy Management
- Alternative Fuels Data Center, Federal and State Laws and Incentives
- U.S. Department of Health and Human Services, Administration for Children and Families, Office of Community Services, Low Income Home Energy Assistance Program (LIHEAP)
- U.S. Department of Energy, Office of Indian Energy Policy and Programs
- Lawrence Livermore National Laboratory, Energy Flow Charts
- National Renewable Energy Laboratory, State and Local Planning for Energy (SLOPE)
- National Renewable Energy Laboratory, Tribal Energy Atlas
- EIA Energy Disruptions
- U.S. Department of Agriculture (USDA), Rural Development, Energy Programs