Release Date: April 11, 2023
STEO Perspectives: How do household gasoline costs change under different crude oil price scenarios?
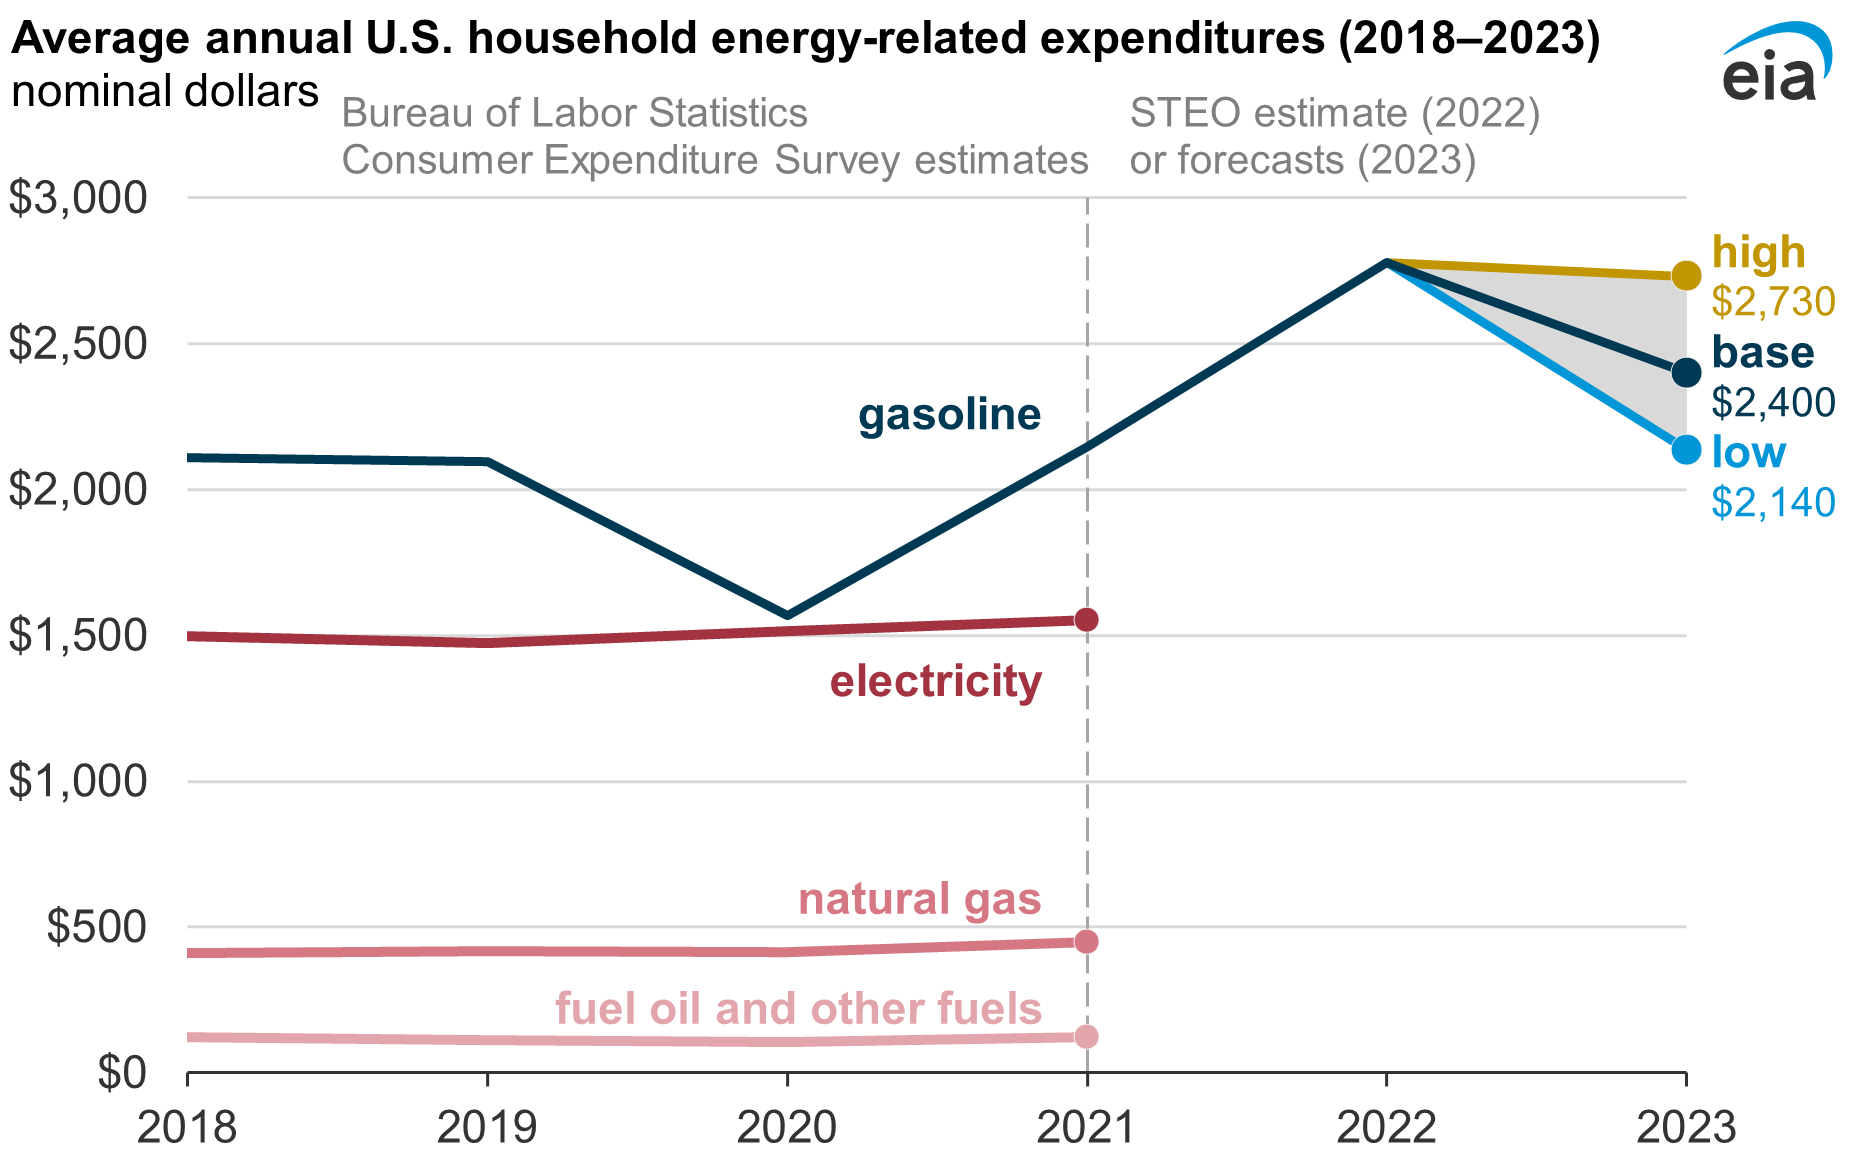
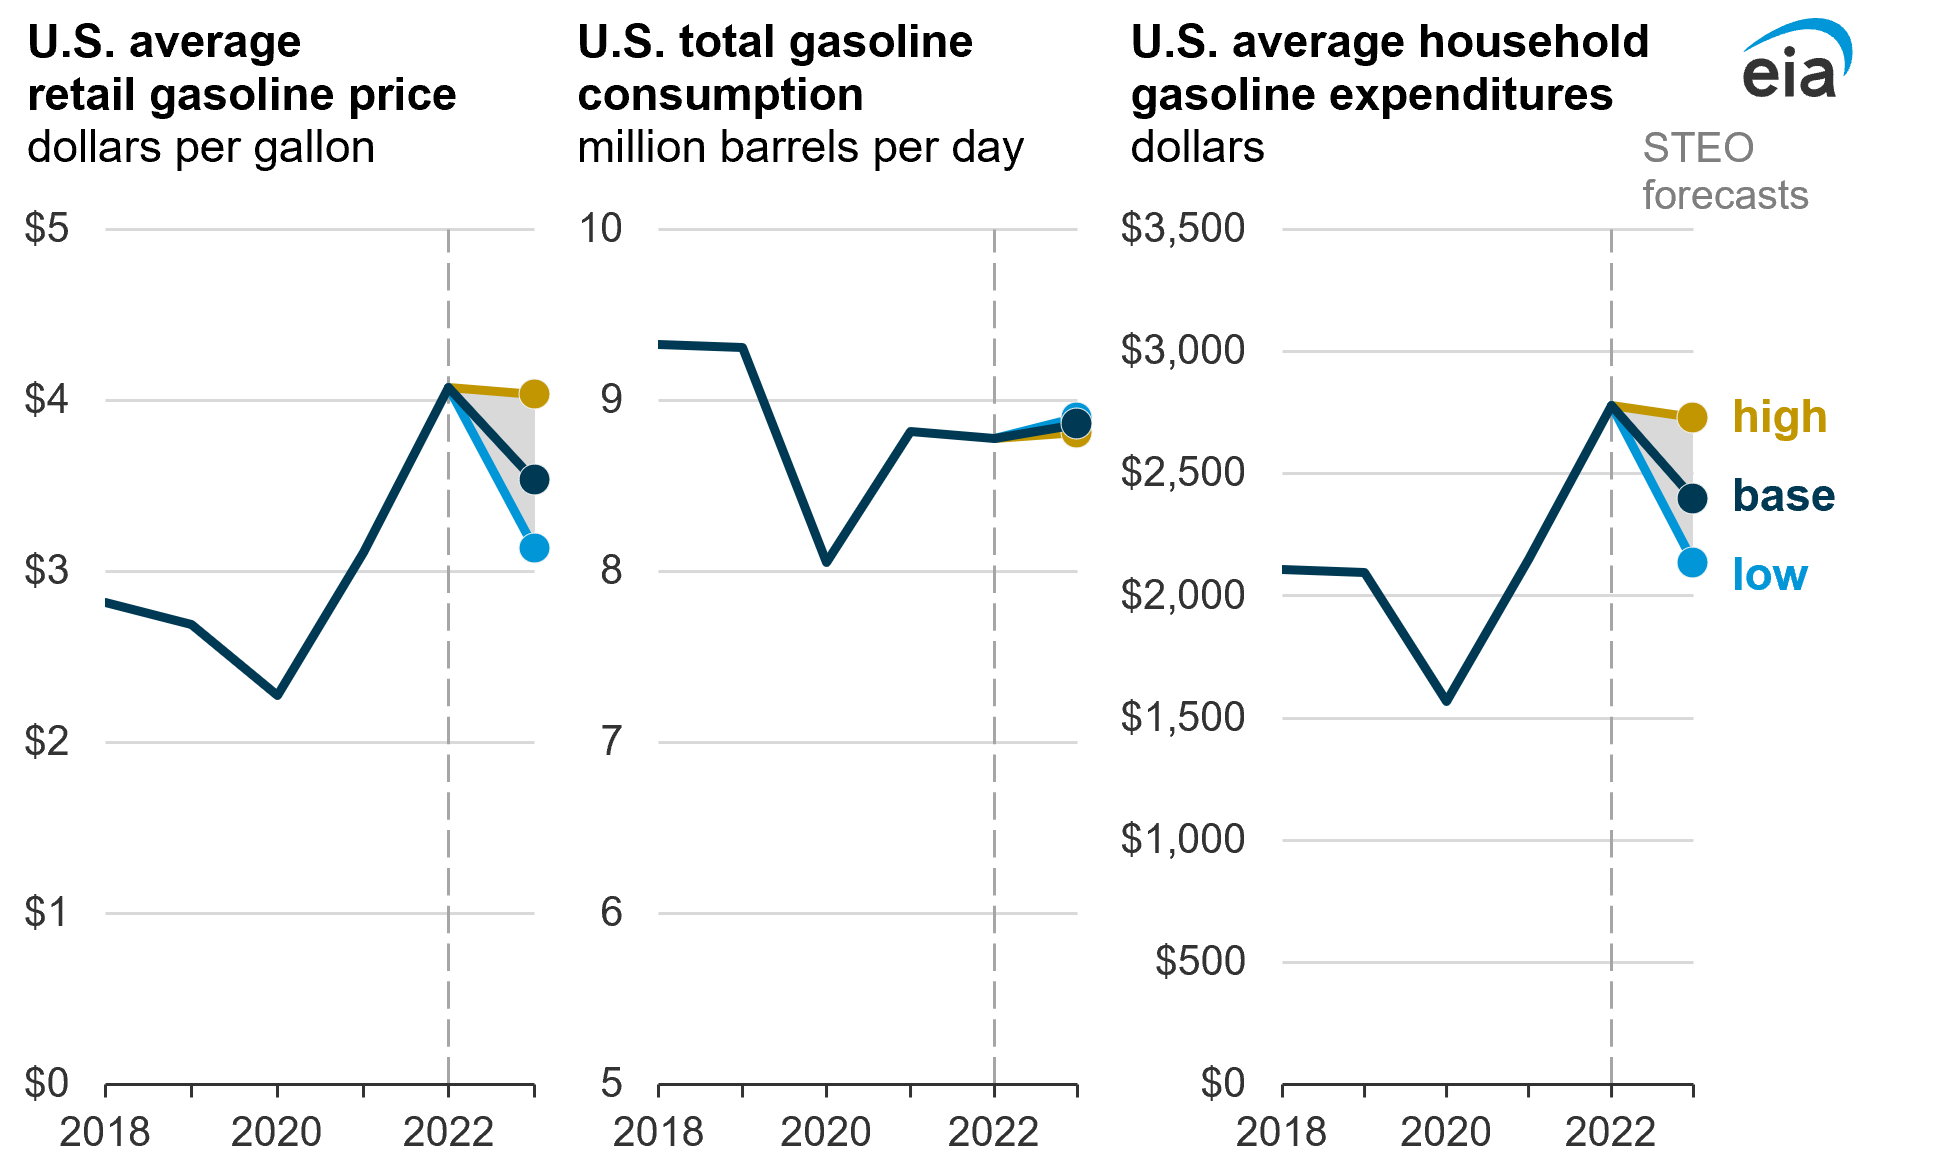
Household expenditures on gasoline are consistently the most expensive category of household spending directly related to energy. In 2021, the most recent year of data in the U.S. Bureau of Labor Statistics’ Consumer Expenditure Survey, average annual household spending on gasoline totaled $2,148—slightly more than electricity, natural gas, and fuel oil combined.
Data values: Consumer Expenditure Survey: Multi-year top line means
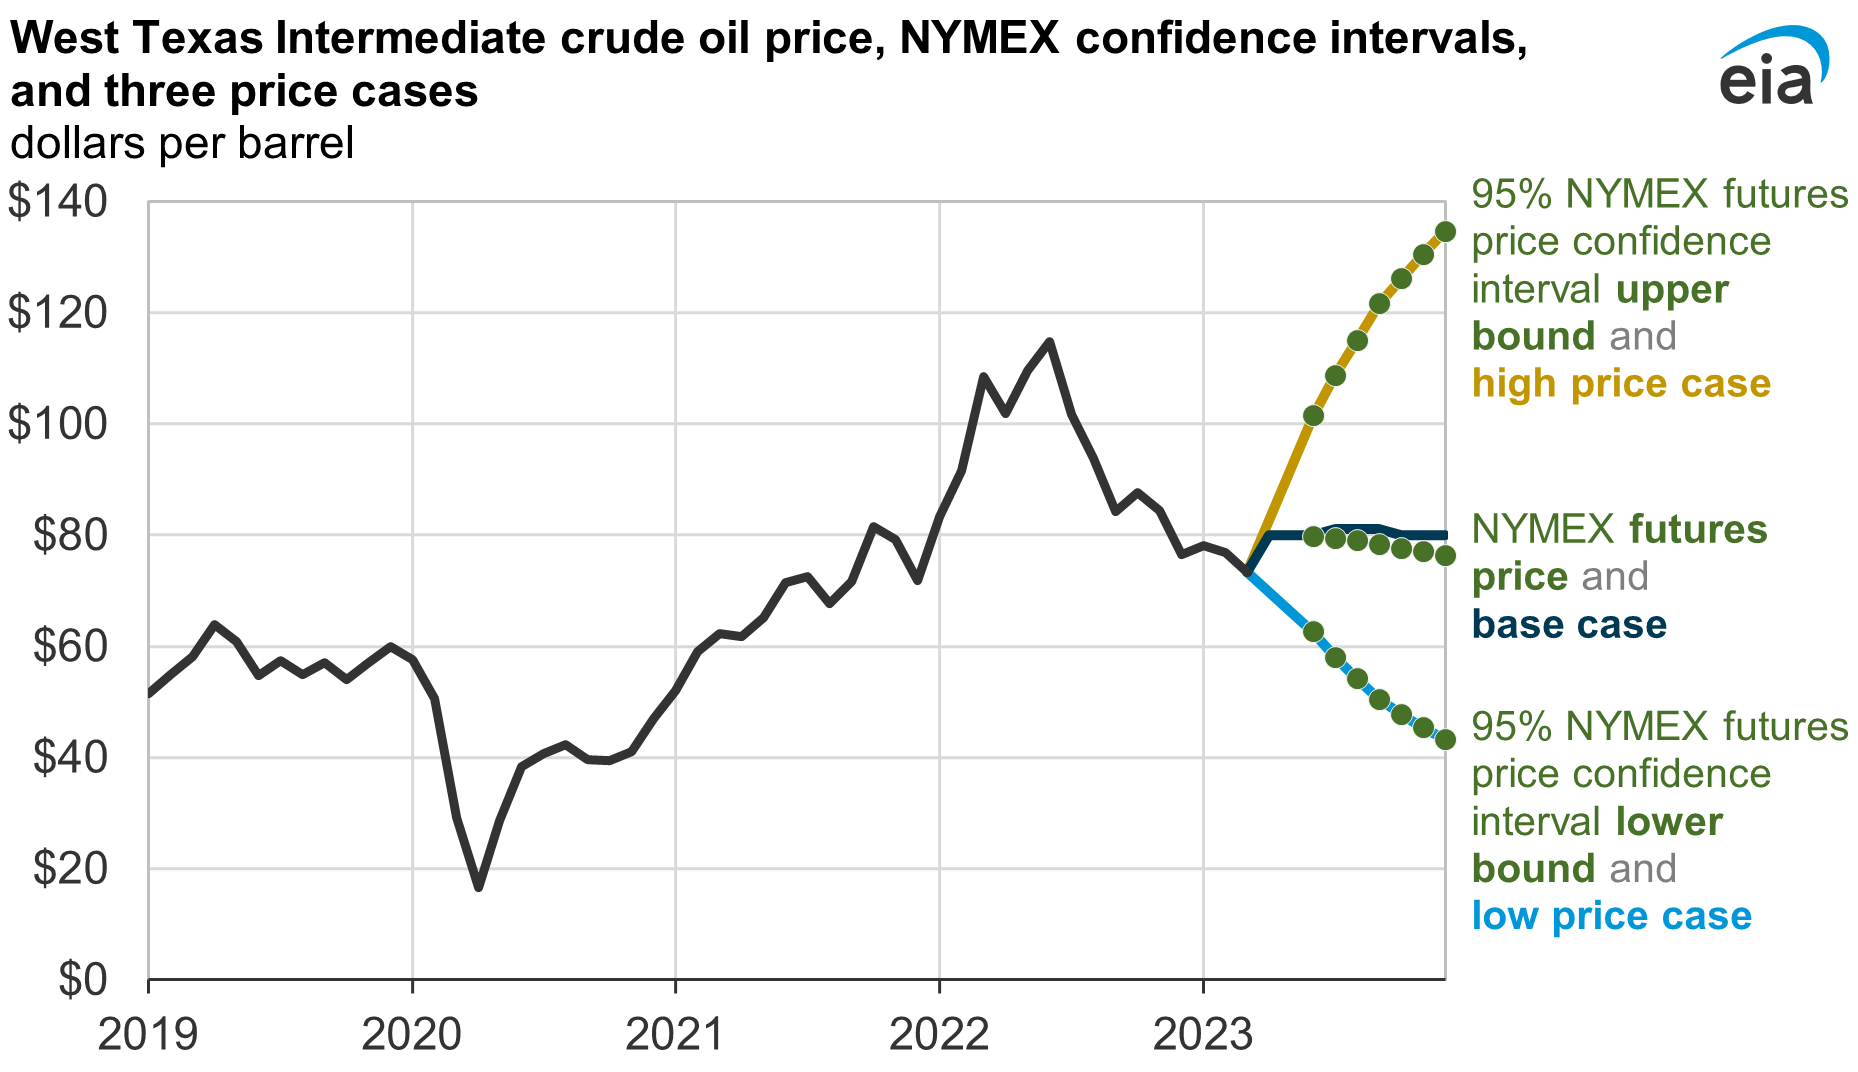
But household spending on gasoline varies with the price of the crude oil used to produce it. This analysis considers a range of annual household spending on gasoline in 2023 under three crude oil price cases. Two of these cases use market-derived expectations of future crude oil prices to establish possible high and low crude oil price outcomes for the remainder of this year. The baseline case is the one we use as our April 2023 Short-Term Energy Outlook (STEO) forecast.
In all three cases we examined, we expect average annual household gasoline spending to be lower in 2023 than our 2022 estimate of $2,780.
Scenario Design
The Consumer Expenditure Survey includes data on household energy expenditures through 2021. We use this series as a baseline for our analysis. To estimate spending for 2022, we adjust 2021 household expenditures to account for observed annual changes in gasoline consumption and price and the number of households in the United States.
For the 2023 forecast, we varied our assumed West Texas Intermediate (WTI) crude oil price across three cases. We then varied the Brent crude oil price by maintaining a consistent $6 per barrel ($/b) difference between WTI and Brent in all cases (as we discuss below). The only assumption we modified across these cases was crude oil prices. We applied the oil price in each case first in our S&P Global macroeconomic model to calculate its effect on economic activity and employment, then modeled these inputs into our Short-Term Integrated Forecast System (STIFS).
Base case
We used the April 2023 STEO crude oil price forecast as our base case, using our independent forecasts of price, global oil production, and consumption as part of STIFS. As part of STEO and this analysis, we assess whether global production and consumption forecasts will lead to builds or draws on global petroleum inventories, which in turn would influence crude oil prices.
In our April STEO, we forecast that the WTI price will increase from its March average of $73/b to $80/b by December 2023 but then fall to $72/b by December 2024. Similarly, we forecast the Brent crude oil price to increase from the March average of $78/b to $86/b by December 2023 but fall to $78/b by December 2024. These price changes reflect our expectation of relatively balanced global inventories through the second half of 2023, followed by world oil production outpacing consumption in 2024.
High and low price cases
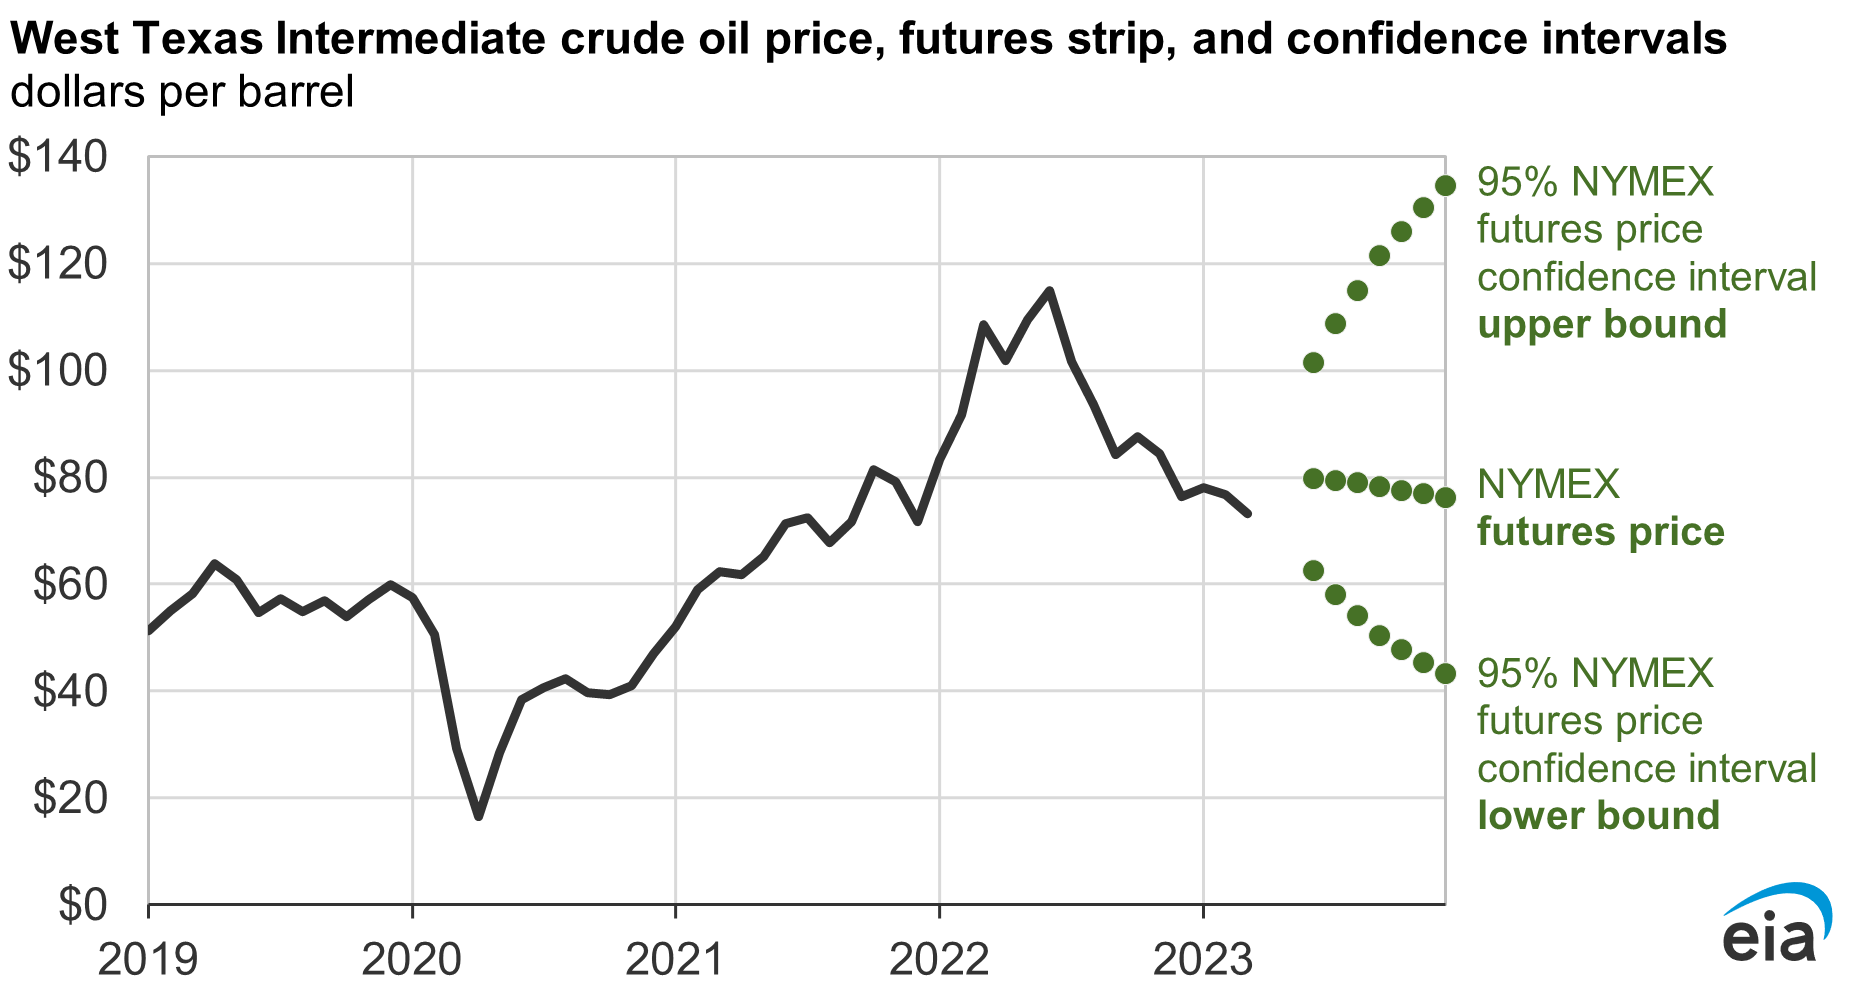
We have been publishing confidence intervals for crude oil and natural gas futures prices since 2009. This confidence interval is a measure of uncertainty around the WTI crude price, which we derive from the prices of NYMEX options contracts on WTI futures contracts. This analysis uses a 95% confidence interval for WTI futures prices. In other words, the trading activity of market participants implies a 95% probability that the price in the expired contract’s delivery month will fall within this range.
Data values: West Texas Intermediate crude oil price
Because we are interested in how gasoline spending changes when the crude oil price changes, we do not address the reasons why crude oil prices could trade at higher or lower prices. We chose the NYMEX 95% confidence intervals on WTI futures to represent price outcomes in the coming months as reflected in the activity of options market participants.
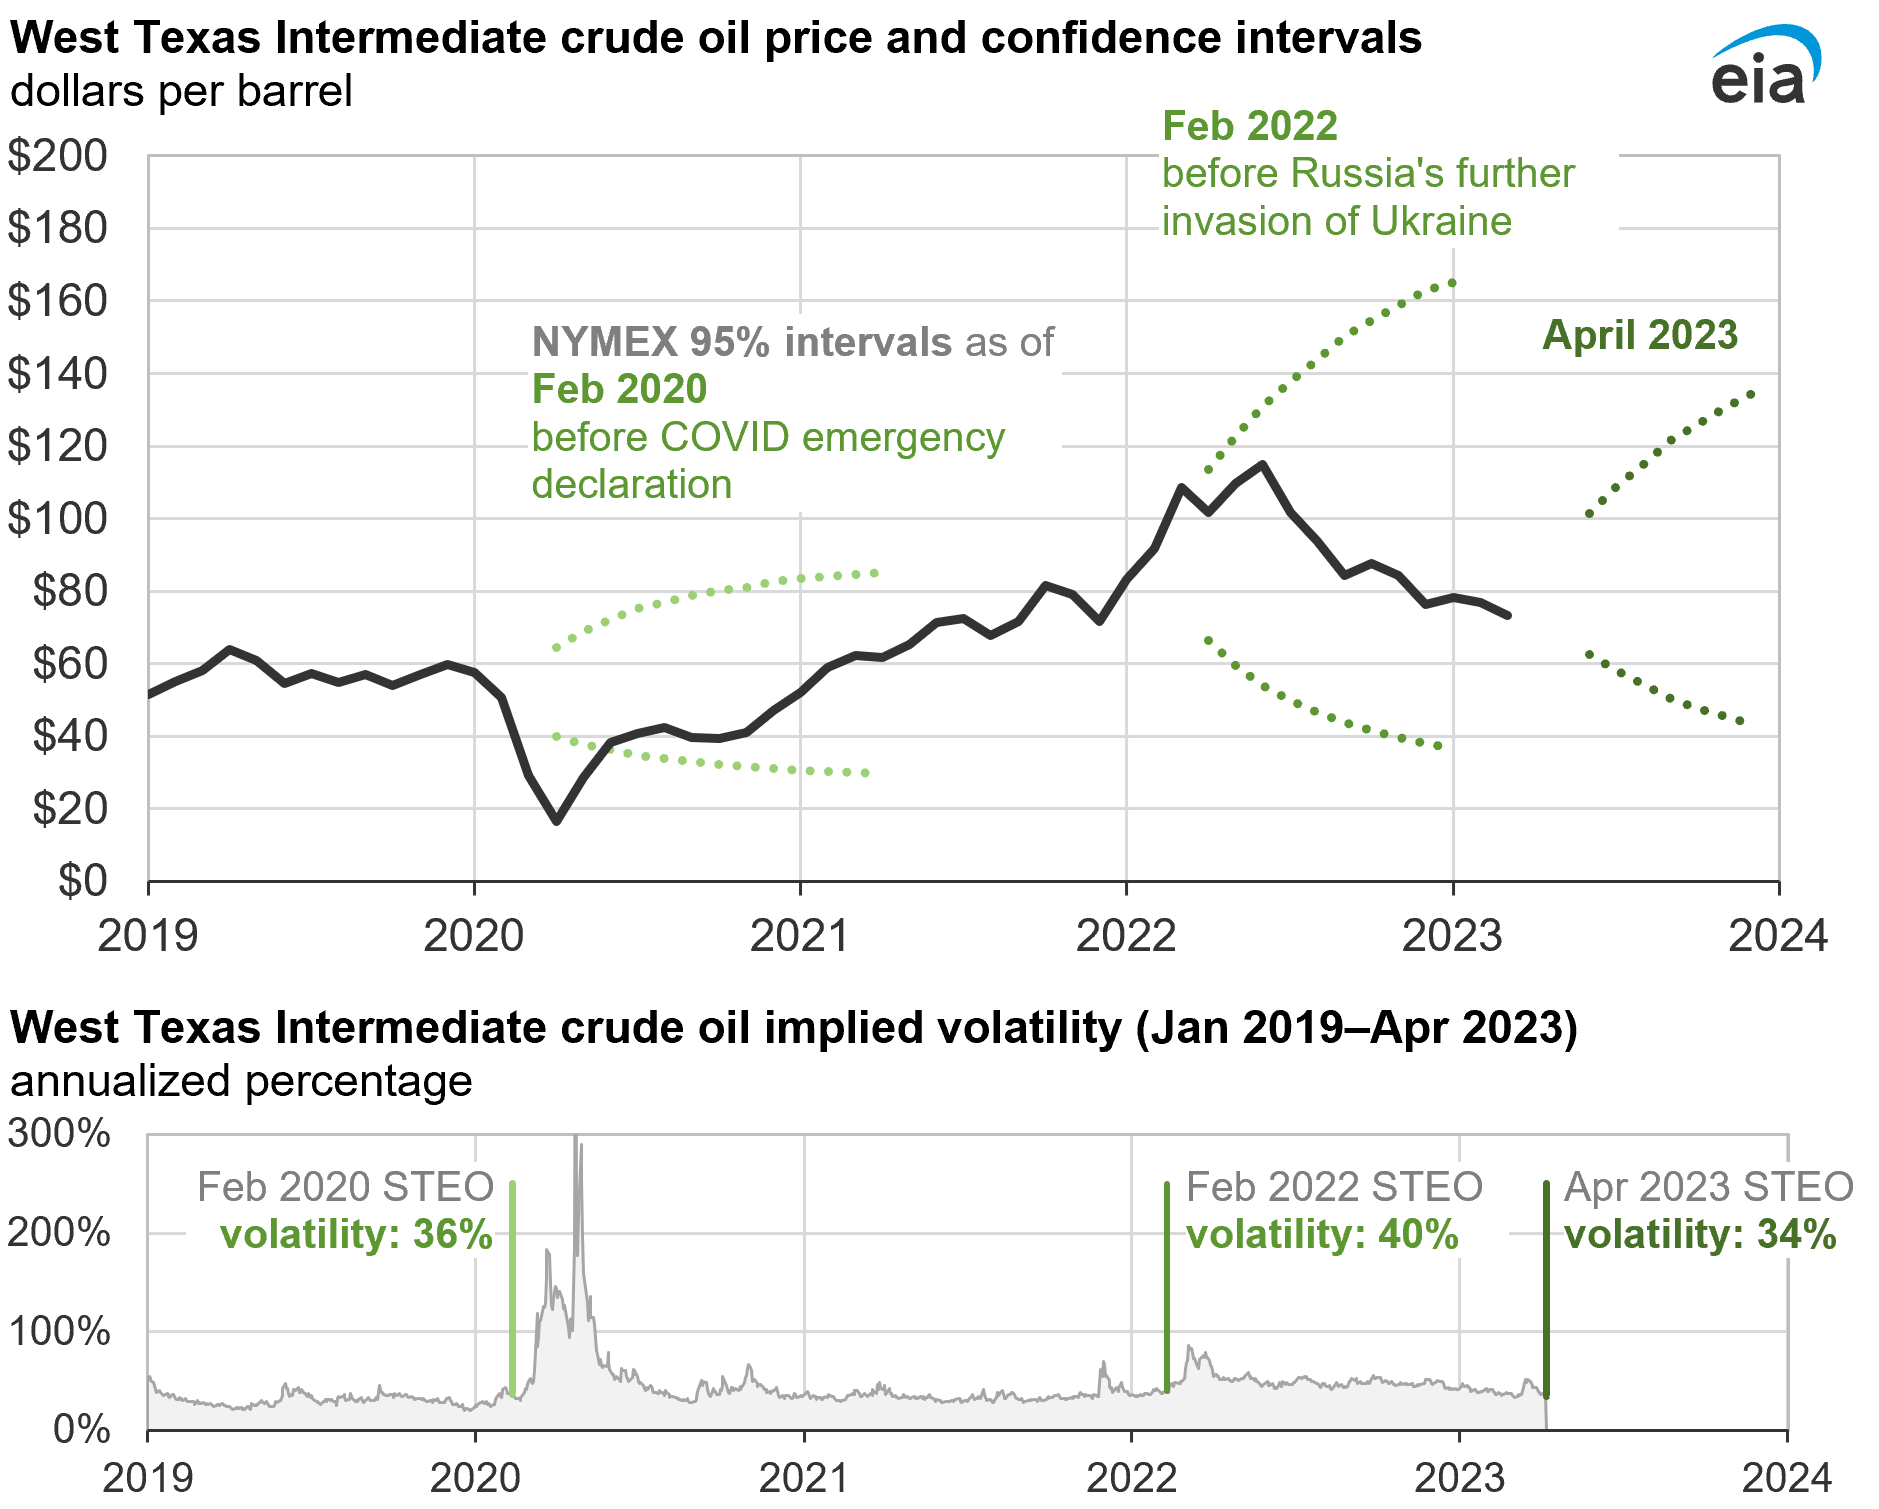
Unexpected shocks to markets can cause crude oil prices to settle close to or even beyond these confidence intervals. The COVID-19 pandemic reduced oil consumption and drove prices below the intervals published in our February 2020 STEO. More recently, after Russia’s full-scale invasion of Ukraine in early 2022, market participant concerns that world oil production would decline caused prices to settle close to the upper bound of the confidence interval published with the February 2022 STEO.
These confidence intervals widen or narrow based on implied volatility of options on crude oil futures contracts. Implied volatility can be derived from how much market participants pay using options to mitigate financial losses or benefit from financial gains associated with changes in crude oil futures prices. More volatility is associated with more uncertainty and therefore wider intervals. We show implied volatility as an annualized percentage, representing the crude oil price’s standard deviation or average percentage change during one year.
Data values: West Texas Intermediate crude oil price
Note: Implied volatility briefly approached 500% in April 2020.
We derive the 95% NYMEX WTI futures price interval used to develop price assumptions in this analysis from monthly options covering the period through 2024 as traded during the five trading days ending April 6, 2023. As of that time, the upper bound of the WTI price intervals was $101/b in June, increasing to $135/b by December 2023. The lower bound was $63/b in June, falling to $43/b by December 2023. Our high and low price cases use the same values as the upper and lower bounds of our 95% confidence interval.
Data values: West Texas Intermediate crude oil price
Although we develop and publish WTI confidence intervals, Brent crude oil is a global oil benchmark and its price has the most significant effect on the U.S. retail gasoline price. We used the Brent crude oil price path to determine the U.S. retail gasoline price for each case.
Key Assumptions
Crude oil is the main determinant in retail gasoline prices. According to our Gasoline and Diesel Fuel Update, the price of crude oil usually accounts for more than half of the final retail price of gasoline. In 2022, crude oil accounted for 57% of the retail gasoline price. The next largest share (18% in 2022) is the refinery margin, measured as the difference between the refinery gate price of gasoline, minus the price of crude oil. The refining margin reflects the value of refining crude oil into gasoline. The remaining price composition includes the distribution costs of moving the gasoline to the retail station, retail margins, and fuel taxes.
Other components of retail gasoline prices are not changed directly. Our STEO gasoline price forecast is primarily a function of crude oil prices and gasoline inventory levels. We do not assume any changes to the refining market other than crude oil price changes. We allowed refining and retail margins to change based on the equations used in our base STEO model in each crude oil price case while making no further adjustments.
Crude oil price spreads are the same across cases. Both WTI and Brent crude oil prices are inputs in our model. In developing the cases, we examined the implied volatility of WTI trading, not Brent. As a simplifying assumption to determine the prices, we maintained a consistent price difference between WTI and Brent in each month of the forecast and in each of the three cases.
Vehicle travel and fuel economy are relatively unaffected by short-term retail price changes. Our STEO gasoline consumption model is based on two underlying equations: vehicle miles traveled (VMT) and efficiency, measured in miles per gallon (MPG). In both equations, increases in the price of gasoline reduce gasoline consumption; a gasoline price increase would reduce vehicle travel and increase fuel economy. In the short term, changes in gasoline prices affect the forecast of travel to a much greater extent than they affect fuel economy.
Refinery operations are relatively slow to adjust to crude oil price changes. Crude oil and petroleum product prices are not directly used as an input in our forecast for refinery runs. Refinery runs are only affected by crude oil price changes and subsequent gasoline price changes’ effects on consumption. We model refinery runs as a function of petroleum product demand as well as seasonal consumption patterns and maintenance schedules.
Crude oil prices affect broader economic conditions. Because oil price shocks can affect other aspects of the economy, such as employment, we first ran our different oil price cases through the S&P Global macroeconomic model, which determines macroeconomic variables fed into STIFS. Economic growth for 2023 is 0.9% in the high price case and 1.3% in the low price case. By the end of 2023, employment varies from 154.7 million jobs in the high price case and 155.1 million jobs in the low price case.
Results
Varying our assumed crude oil pricing assumptions as described above resulted in a wide range of potential consumer spending on gasoline this year in the United States, mostly due to price effects but also because of changes in driving behavior and resulting gasoline consumption. Retail gasoline prices range from $3.13 per gallon ($/gal) to $4.03/gal in 2023.
Our modeled expectation of average gasoline spending by U.S. households in 2023 ranges from $2,140 to $2,730. In all cases, retail gasoline prices and average household spending on gasoline were less than in 2022 when gasoline prices averaged $4.08/gal and household gasoline spending was $2,780.
Secondary Effects
Although we assume that U.S. gasoline demand remains relatively unchanged as we vary prices, the crude oil price has some effect on consumer behavior. The direct impact of changing the crude oil price on the gasoline price flows into our forecast for travel through a limited sensitivity to the retail price. As a result, 2023 U.S. vehicle miles traveled decreased 0.4% in the high price case and increased 0.4% in the low price case. The change in vehicle travel flows directly into a change in total gasoline consumption.
Changes to the crude oil price across cases also affected refining and retail margins for gasoline, calculated as the difference between the Brent crude oil price and the retail gasoline price. Generally, as crude oil prices increase, our models reflect our assumption that refining and retail margins decrease in response to an increase in crude oil prices. Similarly, as crude prices decrease, margins increase.
On an annual basis for 2023, these margins were 7 cents per gallon (cents/gal) lower in the high price case than in the base case and 5 cents/gal higher in the low price case than the base case. This change reflects a shrinking gasoline margin in response to the higher crude oil costs.
Sources of Uncertainty
Forecasting gasoline consumption in cases with rapid price changes is inherently uncertain. Gasoline consumption is driven by consumer choices and behavior. These behaviors can be affected by a wide variety of factors that are not easily captured in economic models, such as:
- Alternative transportation options
- The duration of higher prices
- Consumer responses to specific price points (that is, consumers may have a more noticeable response when prices move above a certain price point—$4/gal or $5/gal, for example)
- The consumer’s ability to change travel plans
Constraints on refinery capacity in response to planned maintenance or unplanned outages, particularly those related to hurricanes or other weather-related phenomenon, can substantially affect refinery production, refinery margins, and gasoline prices. Pipeline outages or other transportation constraints can also cause price changes across regions within the Unites States. In such cases, gasoline prices could increase significantly regardless of any change in crude oil prices.
Significant events in global crude oil markets, such as OPEC production decisions or sanctions like those placed on Russia in 2022, could also affect refiner crude oil acquisition costs. Such events can make it easier or harder for refiners to meet global fuels demand, which can affect refiner margins and retail prices. Earlier this year, we outlined the main sources of uncertainty for our crude oil price forecast.