Released: September 4, 2014
Next Release: September 10, 2014
U.S. petroleum product exports continue to rise
U.S. exports of petroleum products, primarily from the Gulf Coast (PADD 3), have continued to increase. Year-to-date product exports through June 2014 (the latest month for which data are available), including gasoline, distillate, jet fuel, petroleum coke, and hydrocarbon gas liquids (HGL), averaged 3.7 million barrels per day (bbl/d), up 543,000 bbl/d over last year. Increased exports from the Gulf Coast have accounted for 72% of the growth in total U.S. exports (Figure 1).
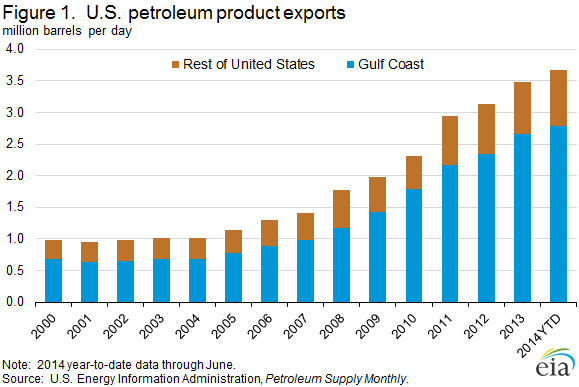
With U.S. refinery runs at or near record levels for much of the year and domestic product demand only slightly higher than last year, product exports have increased to balance supply in the Gulf Coast. However, other U.S. regions, primarily the Northeast (PADD 1A and PADD 1B), continue to rely on imports to meet demand.
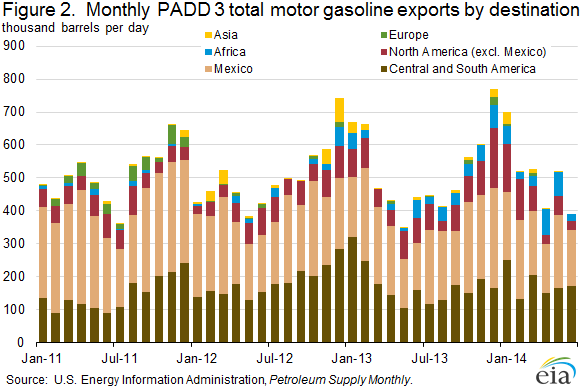
Gulf Coast refineries remain extremely competitive in the global market because of access to cost-advantaged inputs, significant upgrading capacity, and proximity to significant demand centers. As a result, the region supplies large volumes of distillate and gasoline to the global market. Typically, about 90% of Gulf Coast gasoline exports are delivered to the Western Hemisphere. However, there are times when exports reach Africa and even Asia (Figure 2). Gasoline exports to Asia typically peak in the winter months when U.S. demand is at a seasonal low. Gulf Coast distillate production is exported almost exclusively into the Atlantic Basin market, with about 50% going to Central America and South America, 35% to Europe, and 12% to North America, primarily Mexico.
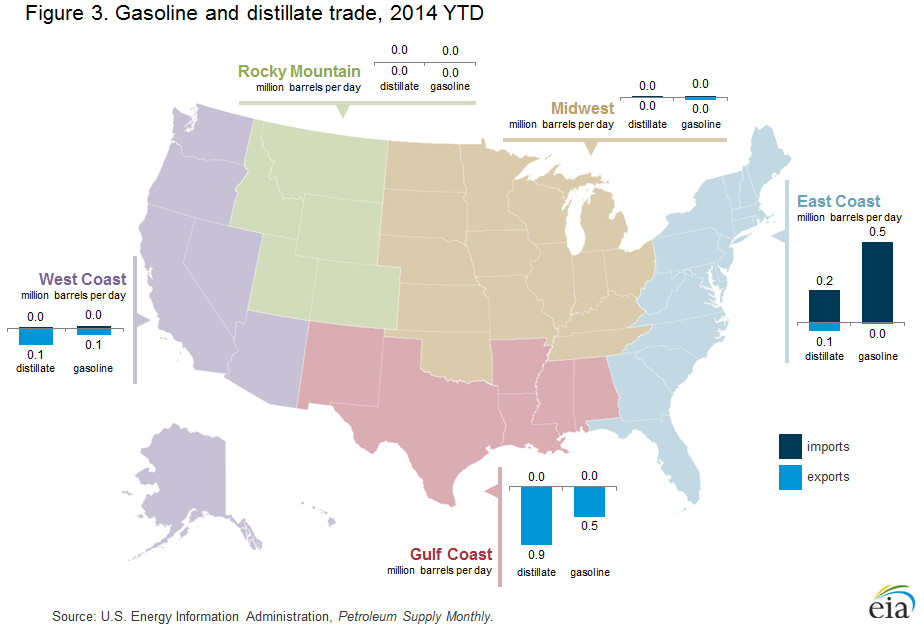
Despite higher total U.S petroleum product exports, the East Coast remains reliant on imports to meet regional demand for both gasoline and distillate. Through June, imports of total motor gasoline to PADD 1 averaged 536,000 bbl/d, 15% less than in the first six months of 2013. PADD 1 distillate imports in the first six months of 2014 averaged 217,000 bbl/d, an increase of 72,000 bbl/d from the same period last year, due in large part to higher demand caused by cold weather this past winter. The East Coast also receives substantial volumes of gasoline and distillate from the Gulf Coast, by pipeline, barge, and tanker. However, pipeline capacity and marine shipping constraints limit how much Gulf-Coast-produced gasoline and distillate can be economically transferred to the East Coast.
The Midwest and Rocky Mountains (PADDs 2 and 4, respectively), despite sharing a border with Canada, conduct minimal global trade in gasoline and distillate (Figure 3). However, PADD 2 does export pentanes plus to Canada. Exports of pentanes plus are rising as demand for diluent used in the production and transportation of oil sands crude increase.
The West Coast (PADD 5) has shifted in recent years from a net importer of refined products to a net exporter. Increasing domestic crude production has allowed Rocky Mountain and inland PADD 3 refineries, such as those in Utah and West Texas, to increase utilization and to supply petroleum to states such as Nevada and Arizona that were previously supplied by refineries in California. These shipments to PADD 5 from other regions have resulted in increased product exports from PADD 5.
Trade in petroleum products will continue to vary by region as a result of supply and demand dynamics. With U.S. refining capacity in the Gulf Coast far bigger than required to meet regional demand, the Gulf Coast will continue to supply product to other U.S. regions as infrastructure allows, and to the global market as supported by market conditions. At the same time, the Northeast, where in-region refining capacity can supply only a fraction of local demand, will continue to rely on product transfers from other U.S. regions, as infrastructure allows, and on imports from the global market.
U.S. retail gasoline price rises, diesel fuel price decreases
The U.S. average retail price for regular gasoline increased one cent to $3.46 per gallon as of September 1, 2014, but was 15 cents lower than the same time last year. Changes across the regions varied, the Midwest price increased by almost 4 cents to $3.43 per gallon while the West Coast price decreased by three cents to $3.80 per gallon. The Gulf Coast price declined two cents to $3.22 per gallon, while the East Coast price increased by a penny to $3.41 per gallon. The Rocky Mountain price decreased by a penny to $3.64 per gallon.
The U.S. average diesel fuel price decreased by one cent to $3.81 per gallon, 17 cents lower than the same time last year. Prices in all regions of the country fell except on the West Coast, which increased two cents to $4.03 per gallon. The East Coast, Midwest, and Gulf Coast prices decreased one cent to $3.84 per gallon, $3.75 per gallon, and $3.72 per gallon, respectively. The Rocky Mountain price also decreased one cent to $3.87 per gallon.
Propane inventories continue to rise
U.S. propane stocks increased by 1.4 million barrels last week to 76.1 million barrels as of August 29, 2014, 11.5 million barrels (17.8%) higher than a year ago. Gulf Coast inventories increased by 0.6 million barrels and Midwest inventories increased by 0.5 million barrels. East Coast inventories and Rocky Mountain/ West Coast inventories both increased by 0.2 million barrels. Propylene non-fuel-use inventories represented 4.8% of total propane inventories.
Text from the previous editions of This Week In Petroleum is accessible through a link at the top right-hand corner of this page.
 |
 |
||||||
| Retail Data | Change From Last | Retail Data | Change From Last | ||||
| 09/01/14 | Week | Year | 09/01/14 | Week | Year | ||
| Gasoline | 3.459 | Diesel Fuel | 3.814 | ||||
 |
 |
||||||||||||||||||||||||||
|
 |
||||||||||||||||||||||||||
| *Note: Crude Oil Price in Dollars per Barrel. | |||||||||||||||||||||||||||
 |
 |
||||||
 |
 |
||||||
| Stocks Data | Change From Last | Stocks Data | Change From Last | ||||
| 08/29/14 | Week | Year | 08/29/14 | Week | Year | ||
| Crude Oil | 359.6 | Distillate | 123.4 | ||||
| Gasoline | 210.0 | Propane | 76.124 | ||||