Released: August 13, 2014
Next Release: August 20, 2014
Midwest propane inventories show strong growth in recent weeks
Last winter, high propane prices, low inventories and logistical and infrastructure challenges prompted emergency measures to address propane supply shortfalls in the Midwest. Given the severity of last winter's supply challenges, market participants are paying close attention to the adequacy of propane supplies to meet agricultural and heating demands this coming season. While the high-demand season is still some months away, an analysis of propane inventory levels, along with an assessment of propane prices and changes in infrastructure and supply flows, provides some insight into the emerging supply picture.
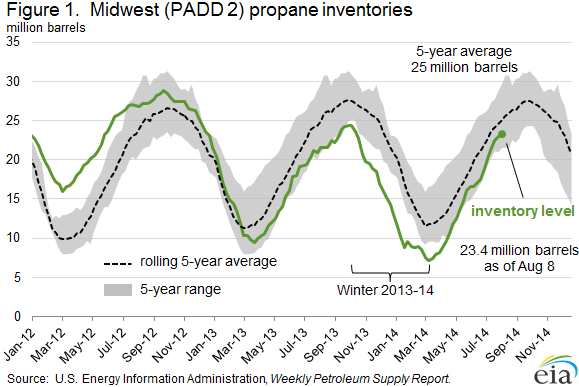
Midwest propane inventories have an annual cycle, with builds occurring from April through September, in advance of the harvest and heating seasons, followed by draws in October through March. Both the level of inventories and the weekly build rate are useful metrics in assessing inventories as of early August. While inventory levels in the Midwest remain below the five-year average, above-average builds over the past six weeks are an encouraging trend. Last year, propane inventories in the Midwest (PADD 2) for the week ending August 9 were 21.5 million barrels, 3.4 million barrels below the five-year average. This year, PADD 2 propane inventories for the week ending August 8 are 23.4 million barrels, 1.9 million barrels higher than last year, but still 1.6 million barrels below the five-year average. However, in each of the past six weeks, PADD 2 propane inventory builds have surpassed their five-year averages, leading to a steady improvement in stock levels relative to their historical norms (Figure 1).
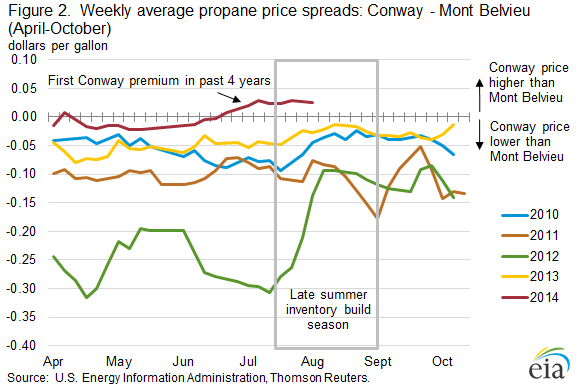
Higher prices at the Midwest propane storage hub in Conway, Kansas, have spurred the strong PADD 2 inventory builds in recent weeks. For the first time in the past four years, Conway prices ahead of peak demand season are at a premium over prices at the Mont Belvieu, Texas, hub (Figure 2). The price of propane at Conway has averaged 2.4 cents higher than the price at Mont Belvieu for the past 6 weeks.
The higher Conway propane price creates an incentive for propane supplies to remain in the Midwest and be placed into storage rather than be shipped to the Gulf Coast via pipeline. Last summer, prices at Conway were below prices at Mont Belvieu, which encouraged the movement of propane supplies to the higher-priced U.S. Gulf Coast market. Currently, Mont Belvieu prices have been pushed lower by inventories that are 8.6 million barrels above the Gulf Coast (PADD 3) five-year average.
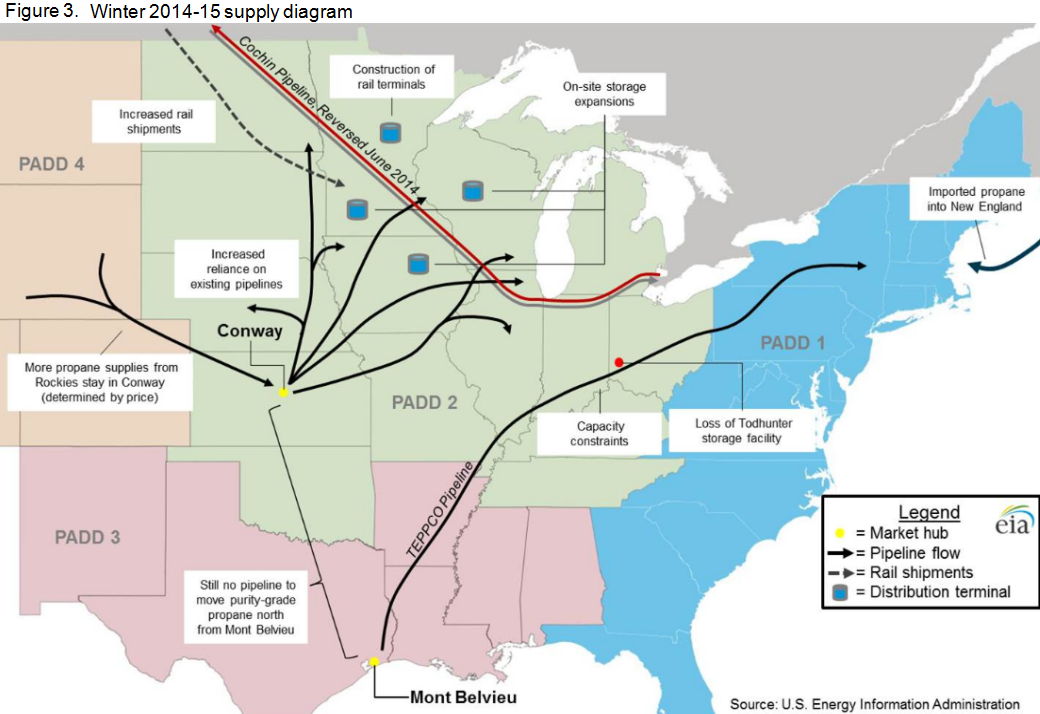
Last year, demand for propane used to dry crops in the Upper Midwest surged just before the start of winter and, as a result, propane inventories at distribution terminals were low before the start of winter heating season. In addition, distribution infrastructure challenges, pipeline maintenance, and rail delivery delays reduced supplies. This year, inventories are building earlier; however, there have been changes in infrastructure that could impact supply. The Cochin Pipeline, which delivered propane to the Upper Midwest from Canada, has been reversed and repurposed, removing a major source of propane supplies to the region.
Propane market participants have responded to the events of last winter and the Cochin reversal by diversifying supply sources. Instead of relying on propane delivered from Canada via Cochin, the region will now rely more on several existing pipelines to deliver propane north to the Upper Midwest from Conway. Additionally, propane rail capacity in the region has expanded via new propane rail terminals throughout the region. Finally, existing distribution terminals have added tanks, thus expanding storage capacity.
Infrastructure challenges for winter propane deliveries also exist in other parts of the Midwest. Todhunter, a major propane storage facility in Butler County, Ohio, closed last fall after leaks were detected and likely will remain closed indefinitely, greatly reducing capacity available to store propane in that region. That facility, which is located along the TEPPCO pipeline system, had provided flexibility in managing pipeline shipments of different products.
The Northeast will continue to rely on imports of propane from Canada and elsewhere for additional supplies (Figure 3).
The U.S. Department of Agriculture is again forecasting a record corn harvest for this year. This year's propane demand for crop drying will depend on fall weather patterns and harvest timing. Winter weather, which directly drives the level of propane use for heating purposes, remains the most important and most difficult-to-predict factor influencing the propane supply-demand balance this winter.
August Drilling Productivity Report indicates continuing oil production growth with upward revision in the Eagle Ford region
The August update to the Drilling Productivity Report (DPR) includes analysis of the Utica region for the first time. Utica region oil production is estimated to reach 40,000 barrels per day (bbl/d) in September 2014, while natural gas production in the region has increased much faster, reaching 1.35 billion cubic feet per day in September 2014. The DPR indicates continuing oil production growth in the key oil-producing regions. Cumulatively, in the Bakken, Niobrara, Permian, and Eagle Ford, oil production is expected to increase by 95,000 bbl/d in September 2014. The monthly growth rate is 16,000 bbl/d more than in August 2014. With new data from the Railroad Commission of Texas, the Eagle Ford region new-well oil production per rig was revised up to 519 bbl/d, nearly matching the Bakken region's 522 bbl/d. EIA expects the Eagle Ford region to produce 1.51 million bbl/d of oil in September 2014, outpacing Bakken production growth due to the Eagle Ford rig count averaging around 110 more rigs than the Bakken since the beginning of 2014.
Propane inventories continue to rise
The U.S. average price for regular gasoline as of August 11, 2014 was $3.51 per gallon, down one cent from the week prior, and six cents less than the same time last year. The Midwest price increased by four cents to $3.45 per gallon, while the Rocky Mountain average rose one cent to $3.65 per gallon. The East Coast and Gulf Coast prices both decreased four cents, to $3.47 and $3.27 per gallon, respectively. The West Coast price decreased two cents to $3.87 per gallon.
U.S. propane stocks increased by 1.8 million barrels last week to 70.3 million barrels as of August 8, 2014, 8.4 million barrels (13.7%) higher than a year ago. Gulf Coast inventories increased by 1.3 million barrels and Midwest inventories increased by 0.5 million barrels. Rocky Mountain/West Coast inventories increased by 0.1 million barrels while East Coast inventories decreased by 0.1 million barrels. Propylene non-fuel-use inventories represented 5.9% of total propane inventories.
Text from the previous editions of This Week In Petroleum is accessible through a link at the top right-hand corner of this page.
 |
 |
||||||
| Retail Data | Change From Last | Retail Data | Change From Last | ||||
| 08/11/14 | Week | Year | 08/11/14 | Week | Year | ||
| Gasoline | 3.505 | Diesel Fuel | 3.843 | ||||
 |
 |
||||||||||||||||||||||||||
|
 |
||||||||||||||||||||||||||
| *Note: Crude Oil Price in Dollars per Barrel. | |||||||||||||||||||||||||||
 |
 |
||||||
 |
 |
||||||
| Stocks Data | Change From Last | Stocks Data | Change From Last | ||||
| 08/08/14 | Week | Year | 08/08/14 | Week | Year | ||
| Crude Oil | 367.0 | Distillate | 122.5 | ||||
| Gasoline | 212.7 | Propane | 70.300 | ||||