Diverging U.S. and global crude oil market fundamentals cause WTI and Brent prices to converge
Market fundamentals influencing U.S. and global oil markets have diverged this summer. Record-high seasonal refinery runs and low inventories in the United States have put upward pressure on prices of U.S. domestic crudes West Texas Intermediate (WTI) and Light Louisiana Sweet (LLS), while low demand in Europe and Asia and unplaced West African crude oil cargoes have depressed North Sea Brent prices. As a result, the Brent-WTI spread has narrowed, with WTI prices briefly reaching a premium to Brent prices for the first time since August 2010. While WTI prices quickly returned to a discount to Brent, the Brent-WTI spread remains relatively narrow, with the July spread averaging $3.92/barrel, the lowest level this year and almost 50% below the 2014 average.
Recent price strength for U.S. domestic crudes compared with Brent has been driven by stronger market fundamentals in the United States versus Europe. High refinery demand and low inventories are putting upward pressure on U.S. crude prices, with WTI in steep backwardation (when near-term prices are higher than longer-term prices) over the front months of the futures curve. Backwardation in WTI reached very high levels as the August contract reached expiration, with the 1st-2nd spread closing at $2.03/barrel on July 22, only the second time in more than 10 years the spread has closed above $2/barrel. U.S. refineries have maintained high utilization rates over the summer, with refinery runs reaching 16.8 million barrels per day (bbl/d) for the week ending July 11, a record high. Runs remained at the record level for most of July. Access to cost-advantaged crude, along with increasing domestic and export product demand, have kept U.S. refinery margins strong, encouraging high runs.
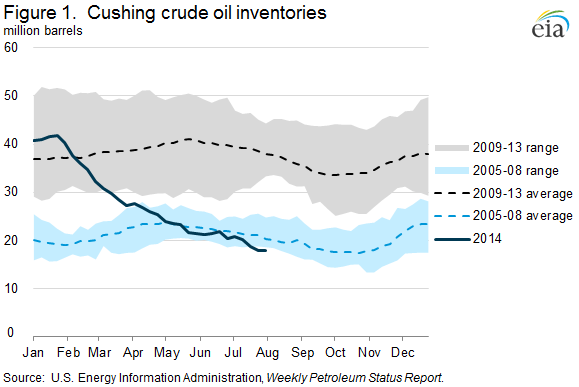
High refinery runs and expanded pipeline takeaway capacity have pulled crude from inventory. Year-to-date, crude oil stocks at the Cushing, Oklahoma, crude oil trading hub have fallen 22.7 million barrels (56%). Cushing stocks had increased significantly during 2012 as growing U.S. crude oil production in the Mid-Continent exceeded the capacity of infrastructure to move production out of the region. Current stocks are now below the pre-2012 buildup levels, falling to the lowest absolute level since 2008 and the lowest level for this time of the year since 2004 (Figure 1).
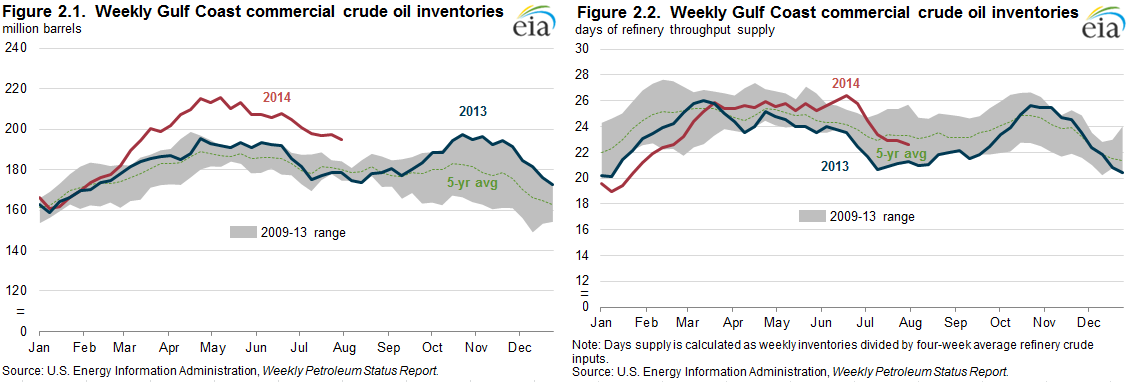
New infrastructure has made it possible for stocks at Cushing to flow south, particularly the 700,000-bbl/d Marketlink pipeline that began operations in January and runs from Cushing to the Texas Gulf Coast. As a result, PADD 3 stocks have increased well above the five-year range. However, when the sharp decline of crude imports and high refinery runs on the Gulf Coast are taken into account, PADD 3 inventories are relatively low on a days-of-supply basis (Figure 2) and that has put upward pressure on domestic crude prices.
In contrast to the robust U.S. market, weak petroleum demand and high inventories in Europe are weighing on Brent prices.
Refinery runs in Europe have been low, affected by weak margins, falling product demand, and stiff competition from foreign refineries, particularly those in the United States and Russia. The very high U.S. refinery runs this summer have put pressure on European refining margins through increased U.S. exports of gasoline that compete with European supply to the global market. European refineries produce more gasoline than is consumed in Europe. As a result, European refineries rely on exports to balance refinery production. According to trade press, gasoline inventories in North West Europe recently reached the highest level since 2010. European refiners are also facing pressure on diesel margins. Recent upgrades to Russian refineries have enabled them to produce large quantities of ultralow-sulfur distillate (ULSD) for export to Europe, lowering diesel crack spreads for European refiners.
Reduced European refinery crude runs combined with lower U.S. imports of African light sweet crude have increased crude supply in the European/Mediterranean market and, as a result, Brent crude oil prices have declined. In addition, refinery maintenance in Asia has limited the flow of Brent and African crude oil barrels eastward. Trade press has reported numerous cargos of light sweet crude oil, especially West African barrels, without buyers late into their contract periods, putting additional downward pressure on Brent prices.
The geopolitical risk premium for near-term Brent crude — which rose sharply in June — has also lessened as militant gains in Iraq slowed and Libya announced the ending of force majeure on oil sales. While the long-term outlook for Libyan production remains uncertain, crude oil markets have greater confidence in the deliverability of oil volumes already physically in storage at ports. This has contributed to a relatively looser near-term supply outlook for seaborne Brent-like crude, which is reflected in the contango (when near-term prices are lower than longer-term prices) structure of the front of the Brent futures curve, which is unusual for the Brent market.
Over the past few days, global crude oil prices have declined because of ample supply compared with demand, with U.S. crude prices falling more than Brent. As a result, the Brent-WTI spread has widened, reaching $6.79 on August 6. WTI prices have been affected by a decline in PADD 2 refinery runs, which operated at 3.8 million bbl/d (100.3% utilization) in early July. Since then, PADD 2 refinery runs have fallen 247,000 bbl/d (6%). Seasonally, U.S. refinery runs typically decline from July to August, falling by an average of 174,000 bbl/d in the past five years. With lower refinery demand, stocks at Cushing halted their decline, rising 83,000 barrels for the week ending August 1. Cushing stock had declined an average of 1 million barrels per week over the prior three weeks, reducing Cushing stocks by 14%. While the recent stock build is minor compared to overall inventory levels, the gain is in contrast to substantial stock draws in July.
Gasoline and diesel fuel prices decrease
The U.S. average price for regular gasoline as of August 4, 2014 was $3.52 per gallon, down 2 cents from the previous week, and 12 cents lower than last year at the same time. Prices decreased in all regions of the nation except the Midwest, which saw an increase of one cent to $3.42 per gallon. The East Coast and Gulf Coast had the largest decreases, falling four cents to $3.50 per gallon and $3.31 per gallon, respectively. The West Coast followed, down three cents to $3.89 per gallon. The Rocky Mountain price decreased less than a penny, to $3.64 per gallon.
The average U.S. diesel fuel price decreased by half a cent to $3.85 per gallon, down six cents from the same time last year. Diesel prices in every region decreased, with the Gulf Coast and Rocky Mountain prices both down a penny, to $3.75 per gallon and $3.88 per gallon, respectively. The East Coast, Midwest, and West Coast prices all decreased less than a penny, remaining at $3.91 per gallon, $3.80 per gallon, and $4.02 per gallon, respectively.
Propane inventories continue to rise
U.S. propane stocks increased by 1.3 million barrels last week to 68.5 million barrels as of August 1, 2014, 6.7 million barrels (10.8%) higher than a year ago. Gulf Coast inventories increased by 1.0 million barrels and Midwest inventories increased by 0.5 million barrels. East Coast inventories decreased by 0.2 million barrels while Rocky Mountain/ West Coast inventories remained unchanged. Propylene non-fuel-use inventories represented 6.1% of total propane inventories.
Text from the previous editions of This Week In Petroleum is accessible through a link at the top right-hand corner of this page.
 |
 |
||||||
| Retail Data | Change From Last | Retail Data | Change From Last | ||||
| 08/04/14 | Week | Year | 08/04/14 | Week | Year | ||
| Gasoline | 3.515 | Diesel Fuel | 3.853 | ||||
 |
 |
||||||||||||||||||||||||||
|
 |
||||||||||||||||||||||||||
| *Note: Crude Oil Price in Dollars per Barrel. | |||||||||||||||||||||||||||
 |
 |
||||||
 |
 |
||||||
| Stocks Data | Change From Last | Stocks Data | Change From Last | ||||
| 08/01/14 | Week | Year | 08/01/14 | Week | Year | ||
| Crude Oil | 365.6 | Distillate | 124.9 | ||||
| Gasoline | 213.8 | Propane | 68.480 | ||||