Released: July 23, 2014
Next Release: July 30, 2014
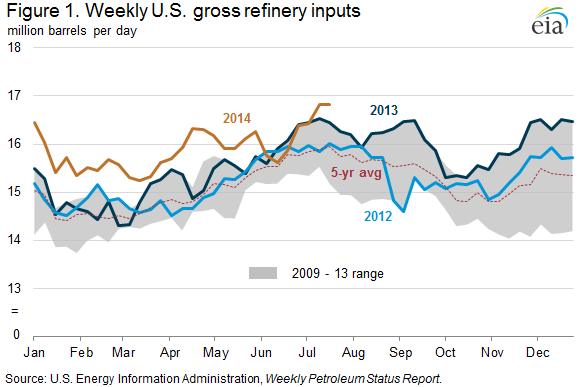
U.S. refineries running at record levels
Refinery inputs hit a record-high 16.8 million barrels per day (bbl/d) for the week ending July 11, eclipsing the previous record from summer 2005 and more than 280,000 bbl/d higher than a year ago. Inputs remained at 16.8 million bbl/d for the week ending July 18 as well (Figure 1). Inputs at refineries in Petroleum Administration for Defense Districts (PADDs) 2 and 3 (Midwest and Gulf Coast, respectively) were particularly strong, reflecting Midcontinent refiners' access to cost-advantaged crude oil, recent refinery capacity expansions, growing domestic demand, and increasing exports.
Refinery gross inputs in the Midwest have been higher than the five-year range since late April. In most years, Midwest receipts of motor gasoline from the Gulf Coast increase during the summer. However, because of recent and planned changes to pipeline infrastructure that have altered the types of products moved, along with the reversal of another line, less gasoline is expected to enter the Midwest from the Gulf Coast this summer, increasing the incentive for in-region gasoline production. According to EIA's refinery capacity report,the Midwest has 275,000 bbl per calendar day (7.9%) more operating atmospheric crude distillation unit (ACDU) capacity in April 2014 than a year earlier, which has potentially offset the loss of intra-regional gasoline movements. Trade press also indicates that BP's expansion of its Whiting, Indiana, refinery (now with 413,500 bbl/d capacity) became fully operational this spring.
The Midwest's record-high runs of 3.8 million bbl/d for the week ending July 11 pushed PADD 2 utilization to 100.3%, the first time any PADD has exceeded 100% since EIA began publishing weekly PADD-level utilization in June 2010. Although it may seem counterintuitive, utilization can exceed 100% because it is calculated based on calendar-day ACDU capacity, which takes into account usual operating conditions, including both planned and unplanned outages. However, under ideal conditions, a refinery can process more than its calendar-day capacity. When PADD 2 gross inputs for the week are compared to the region's stream-day capacity of 4.1 million bbl/d, reflecting in-region nameplate ACDU capacity, the utilization rate is 93%. Monthly refinery utilization data back to 1985 shows utilization in PADD 2 exceeded 100% in many months through mid-2000, but has not since.
Realization of long-anticipated capacity expansions in the Gulf Coast region has also pushed PADD 3 runs to record levels. Trade press reports that Motiva Port Arthur's expansion became fully operational in late June, enabling the facility to run more than 600,000 bbl/d of gross inputs. With that boost, PADD 3 gross inputs rose to 8.5 million bbl/d for the week ending June 27 and reached 8.7 million bb/d for each of the following two weeks, just 1,000 bbl/d lower than December 20, 2013's, record level. The United States remains an increasingly active participant in the global petroleum products trade. The Gulf Coast region's competitive advantage based on heavy upgrading capacity, cost-advantaged input and fuel costs, and access to growing markets keeps utilization rates high.
Through April 2014, the latest monthly EIA data available, U.S. demand for petroleum products was 187,000 bbl/d higher than a year ago. Increases in consumption of motor gasoline and distillate of 180,000 bbl/d and 114,000 bbl/d, respectively, outweighed a decline in consumption of all other products of 107,000 bbl/d. Given the increase in domestic demand, rising exports, and expanded refinery capacity, recent record refinery runs may soon be surpassed
Gasoline and diesel fuel prices decrease in all regions
The U.S. average retail price for regular gasoline fell four cents last week to $3.59 per gallon as of July 21, 2014, nine cents less than the same time late year. All regions of the nation registered a price decrease of at least four cents except the Rocky Mountains, where the average price decreased less than half a cent to remain at $3.64 per gallon. The West Coast, East Coast, and Midwest prices each decreased by four cents, to $3.96, $3.59, and $3.50 per gallon, respectively. The Gulf Coast price decreased by five cents to $3.39 per gallon.
The national average on-highway diesel fuel price fell three cents to $3.87 per gallon, three cents less than the same time last year. Prices fell in all regions of the nation, with the largest decreases coming in the East Coast, Midwest, and West Coast regions, each down three cents, to $3.93, $3.81, and $4.03 per gallon, respectively. The Gulf Coast and Rocky Mountain prices decreased by a penny, to $3.77 and $3.89 per gallon, respectively.
Propane inventories continue to rise
U.S. propane stocks increased by 2.2 million barrels last week to 65.5 million barrels as of July 18, 2014, 6.0 million barrels (10.2%) higher than a year ago. Midwest inventories increased by 1.4 million barrels and Gulf Coast inventories increased by 0.4 million barrels. East Coast inventories increased by 0.3 million barrels and Rocky Mountain/ West Coast inventories increased by 0.1 million barrels. Propylene non-fuel-use inventories represented 6.4% of total propane inventories.
Text from the previous editions of This Week In Petroleum is accessible through a link at the top right-hand corner of this page.
 |
 |
||||||
| Retail Data | Change From Last | Retail Data | Change From Last | ||||
| 07/21/14 | Week | Year | 07/21/14 | Week | Year | ||
| Gasoline | 3.593 | Diesel Fuel | 3.869 | ||||
 |
 |
||||||||||||||||||||||||||
|
 |
||||||||||||||||||||||||||
| *Note: Crude Oil Price in Dollars per Barrel. | |||||||||||||||||||||||||||
 |
 |
||||||
 |
 |
||||||
| Stocks Data | Change From Last | Stocks Data | Change From Last | ||||
| 07/18/14 | Week | Year | 07/18/14 | Week | Year | ||
| Crude Oil | 371.1 | Distillate | 125.9 | ||||
| Gasoline | 217.9 | Propane | 65.451 | ||||