Released: June 18, 2014
Next Release: June 25, 2014
Alternative metrics for Gulf Coast crude oil inventories provide differing perspectives
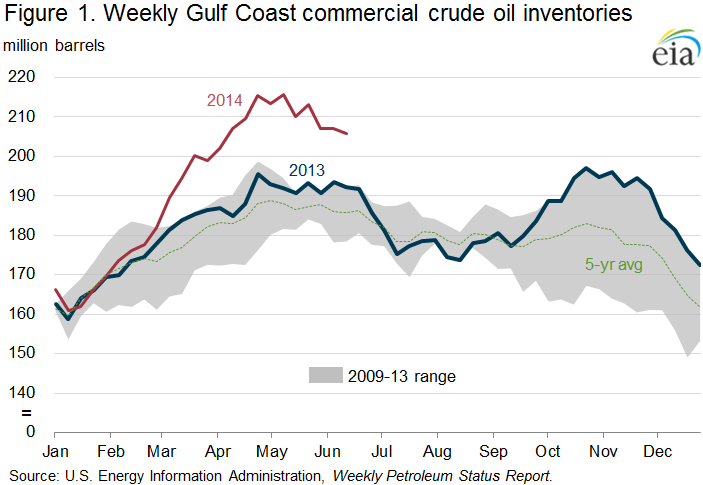
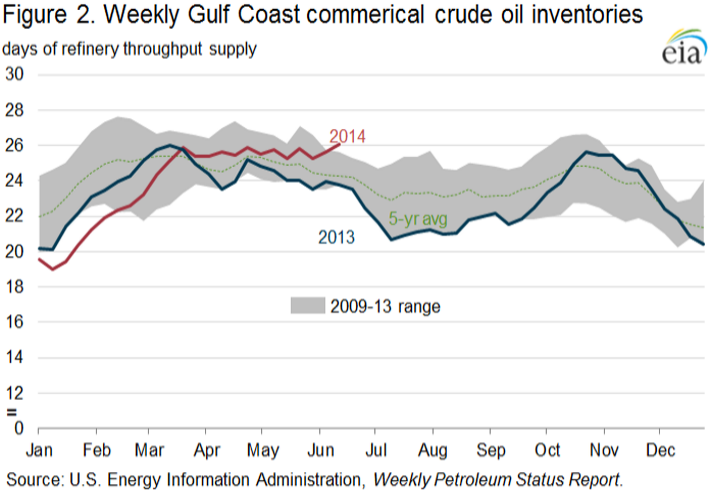
On May 9, Gulf Coast (PADD 3) crude oil inventories reached a record level of 215.7 million barrels (Figure 1), and since then have remained near historically high levels. These higher inventories have been attributed to the logistical changes that have enabled crude to flow more freely from the Cushing, Oklahoma, storage hub and crude oil production centers to refining centers on the Gulf Coast. However, when stated as days supply of regional refinery throughputs, inventories are much closer to historically typical levels (Figure 2), consistent with the operating requirement of increased crude processing at PADD 3 refineries.
Gulf Coast refineries have been running at near record levels for much of 2014. Through May, crude inputs at Gulf Coast refineries averaged 8.1 million barrels per day (b/d), an increase of 0.5 million b/d compared with the same period in 2013. Price-advantaged crude oil and natural gas feedstocks have encouraged high utilization rates at PADD 3 refineries. Crude oil distillation capacity additions have also supported higher crude runs. All other factors equal, increased refinery crude runs increase crude inventories required for operations.
Based on the most recent EIA weekly data, Gulf Coast crude oil inventories were 205.8 million barrels on June 13, and average crude inputs at Gulf Coast refineries for the previous four weeks were 7.9 million b/d. Thus, PADD 3 inventories were sufficient to supply 26.1 days of regional crude demands. This is only slightly above the PADD 3 five-year average of 24.3 days supply for this time of year.
While absolute levels of crude inventories on the Gulf Coast have been 11.2 million barrels higher on average year-to-date in 2014 than over the same period in 2013, on an average days-supply basis, the 2014 year-to-date average of 23.8 days is unchanged from the 2013 level. Even when Gulf Coast crude oil inventories reached an absolute record of 215.7 million barrels on May 9, supply of 25.7 days was only 0.6 days more than the five-year average.
To accommodate the increased inventories, market participants have been adding crude oil storage capacity. As of March 31, total working crude oil storage capacity on the Gulf Coast was 275.4 million barrels, up 2.1 million barrels (0.8%) from six months earlier, and up 5.1 million barrels (2.1%) from March 2013. Of the total working storage capacity on March 31, 202.3 million barrels was at crude oil tank farms and 73.1 million barrels at refineries. EIA reports Working and Net Available Shell Storage Capacity twice a year. The storage reports are released at the end of May and November, reporting storage as of March 31 and September 30, respectively. On March 31, Gulf Coast crude inventories were 199.3 million barrels, or 72% of available capacity. This utilization rate was up compared with 68% (186.2 million barrels) in the last survey and 69% (186.4 million barrels) a year earlier. However, actual utilization was likely lower than that, because EIA inventory data include volumes in pipelines, while storage capacity does not include pipeline capacity.
Gasoline prices increase, diesel fuel prices mostly lower
The average U.S. price for regular gasoline increased by one cent this week to $3.69 per gallon as of June 16, 2014, six cents more than the same time last year. All regions of the country experienced price increases. The Rocky Mountain and Midwest prices each increased two cents, to $3.53 and $3.71 per gallon respectively. The Gulf Coast and East Coast prices both rose by a penny, to $3.43 and $3.64 per gallon respectively. The West Coast price increased by less than a cent, to remain at $4.00 per gallon.
The average U.S. diesel fuel price decreased by one cent to $3.88 per gallon, four cents more than the same time last year. The Gulf Coast price saw the only increase, by less than a penny, to remain at $3.77 per gallon. The East Coast and Rocky Mountain prices each fell by two cents, to $3.96 and $3.89 per gallon respectively. The Midwest price decreased by one cent to $3.84 per gallon, while the West Coast decreased by less than a penny to $3.99 per gallon.
Propane inventories continue to rise
U.S. propane stocks increased by 2.0 million barrels last week to 51.2 million barrels as of June 13, 2014, 1.9 million barrels (3.5%) lower than a year ago. Gulf Coast inventories increased by 1.6 million barrels and East Coast inventories increased by 0.4 million barrels. Rocky Mountain/ West Coast inventories increased by 0.1 million barrels while Midwest inventories remained unchanged. Propylene non-fuel-use inventories represented 8.0% of total propane inventories.
Text from the previous editions of This Week In Petroleum is accessible through a link at the top right-hand corner of this page.
 |
 |
||||||
| Retail Data | Change From Last | Retail Data | Change From Last | ||||
| 06/16/14 | Week | Year | 06/16/14 | Week | Year | ||
| Gasoline | 3.686 | Diesel Fuel | 3.882 | ||||
 |
 |
||||||||||||||||||||||||||
|
 |
||||||||||||||||||||||||||
| *Note: Crude Oil Price in Dollars per Barrel. | |||||||||||||||||||||||||||
 |
 |
||||||
 |
 |
||||||
| Stocks Data | Change From Last | Stocks Data | Change From Last | ||||
| 06/13/14 | Week | Year | 06/13/14 | Week | Year | ||
| Crude Oil | 386.3 | Distillate | 119.4 | ||||
| Gasoline | 214.3 | Propane | 51.241 | ||||