Released: June 11, 2014
Next Release: June 18, 2014
Expected growth in non-OPEC production reduces the call on OPEC crude required to balance the market
On June 11, the Organization of the Petroleum Exporting Countries (OPEC) reaffirmed the group's crude oil production target of 30 million barrels per day (bbl/d) that has been in place since December 2011. This target is slightly above the 29.8-million-bbl/d call on OPEC crude oil and global stocks during 2014 presented in the June Short-Term Energy Outlook (Figure 1).
The expected 2014 average call on OPEC and global stocks is 0.3 million bbl/d lower than in 2013, with an additional 0.2-million-bbl/d decline during 2015 to an average of 29.6 million bbl/d. Growing non-OPEC supply, particularly from continuing tight oil production growth in the United States, drives the expected easing of global oil market conditions and contributes to the forecast of moderate crude oil price declines, with North Sea Brent crude oil prices averaging $108/bbl in 2014 and $102/bbl in 2015, down from an average of $109/bbl in 2013.
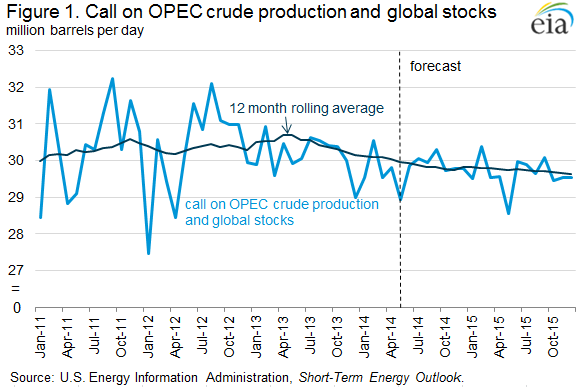
The call on OPEC crude oil and global stocks is a key indicator used by analysts to assess the general condition of global oil markets. It is calculated as world consumption less non-OPEC supply and OPEC noncrude oil supply. An increase in the call means more crude oil supply from OPEC or a drawdown of stockpiles is expected to be needed to meet global demand.
The expected decline in the 2014 and 2015 call on OPEC crude oil and global stocks is part of a continuing trend in which strong growth in non-OPEC liquid fuels production has reduced the amount of OPEC crude needed to balance global supply and demand. EIA estimates that non-OPEC liquids production grew by 1.4 million bbl/d in 2013, averaging 54.1 million bbl/d for the year. EIA expects non-OPEC liquids production to grow by 1.5 million bbl/d in 2014 and by 1.2 million bbl/d in 2015, with production from tight oil formations in the United States as the main driver. Non-OPEC supply growth surpassed world consumption growth in 2013, and is forecast to do so again in 2014. EIA projects non-OPEC supply growth will be slightly lower than world demand growth in 2015, but a projected 0.3-million-bbl/d increase in OPEC noncrude oil production, largely condensate, continues to reduce the call on OPEC crude and global stocks.
Despite the declining call on OPEC crude supplies to balance the market, recent experience demonstrates that events can intervene to tighten supplies and push prices higher than expected. Unplanned global supply disruptions averaged 3.2 million bbl/d from January to May 2014, up from 2.7 million bbl/d for all of 2013. More than 1 million bbl/d of Libyan production has been offline since the third quarter of 2013 because of sporadic protests at some oil fields and blockades at major oil export terminals. Saudi Arabia has been key in counterbalancing supply disruptions. Despite growing non-OPEC supply, Saudi Arabia has maintained crude oil production levels from 9.5 to 10 million bbl/d during the past year. Because almost all of OPEC's surplus production capacity is in Saudi Arabia, higher levels of Saudi production have lowered levels of OPEC surplus production capacity. Surplus production capacity can act as a shock absorber for global markets, and increasing spare capacity is often considered to exert downward pressure on prices, all other market factors equal. EIA estimates average OPEC spare production capacity at 2.0 million bbl/d during the first half of 2014, up from the end of 2013, but down 0.4 million bbl/d from the first half of 2013.
EIA expects spare capacity will increase over the remainder of the 2014-15 forecast period, averaging 2.4 million bbl/d during the second half of 2014 and 3.5 million bbl/d in 2015. This build in surplus capacity primarily reflects reduction in production to accommodate higher forecast supply levels from Iraq, Angola, and Libya, as well as some non-OPEC producers. These estimates do not include additional capacity that may be available in Iran but is currently offline because of the effects of U.S. and European Union sanctions on Iran's oil sector.
Gasoline and diesel fuel prices decrease
The U.S. average retail price for regular gasoline decreased by two cents this week to $3.67 per gallon as of June 11, 2014, two cents more than the same time last year. Price decreases occurred in all regions of the country except for the Rocky Mountains, which increased less than a cent to $3.51 per gallon. The Midwest and Gulf Coast each declined two cents, to $3.69 and $3.42 per gallon respectively. West Coast and East Coast prices both decreased by a penny, to $4.00 and $3.63 respectively.
The national average price for diesel fuel decreased by three cents from last week to $3.89 per gallon, four cents more than the same time last year. Prices for diesel fuel decreased in all areas of the country. The East Coast, Midwest, Rocky Mountains and West Coast all decreased by three cents, to $3.98, $3.85, $3.91, and $4.00 per gallon respectively. The Gulf Coast price declined by one cent to $3.77 per gallon.
Propane inventories continue to rise
U.S. propane stocks increased by 3.4 million barrels last week to 49.2 million barrels as of June 6, 2014, 0.4 million barrels (0.9%) lower than a year ago. Gulf Coast inventories increased by 2.5 million barrels and Midwest inventories increased by 0.5 million barrels. Rocky Mountain/ West Coast inventories increased by 0.3 million barrels and East Coast inventories increased by 0.2 million barrels. Propylene non-fuel-use inventories represented 8.6% of total propane inventories.
Text from the previous editions of This Week In Petroleum is accessible through a link at the top right-hand corner of this page.
 |
 |
||||||
| Retail Data | Change From Last | Retail Data | Change From Last | ||||
| 06/09/14 | Week | Year | 06/09/14 | Week | Year | ||
| Gasoline | 3.674 | Diesel Fuel | 3.892 | ||||
 |
 |
||||||||||||||||||||||||||
|
 |
||||||||||||||||||||||||||
| *Note: Crude Oil Price in Dollars per Barrel. | |||||||||||||||||||||||||||
 |
 |
||||||
 |
 |
||||||
| Stocks Data | Change From Last | Stocks Data | Change From Last | ||||
| 06/06/14 | Week | Year | 06/06/14 | Week | Year | ||
| Crude Oil | 386.9 | Distillate | 119.0 | ||||
| Gasoline | 213.5 | Propane | 49.214 | ||||