Released: April 23, 2014
Next Release: April 30, 2014
Typical seasonal factors contribute to recent rise in gasoline price
On April 21, the U.S. average retail price for regular gasoline was $3.68 per gallon (gal), an increase of 39 cents/gal since the 2014 low in early February. This recent retail price increase is mostly the result of an increase in crack spreads (the difference between the price of wholesale gasoline and the price of crude oil) attributable to typical seasonal factors such as refinery maintenance and higher travel-related demand as the driving season begins. In 2014, the average crack spread during the first four months of the year has been close to the five-year average. However, the 2014 seasonal increase has been modestly steeper than normal, which partially stems from lower-than-normal crack spreads in January and February. In its April 2014 Short-Term Energy Outlook (STEO), EIA forecasts that retail gasoline prices will continue to rise into May and then begin to ease as refinery runs peak, adding supply to the market.
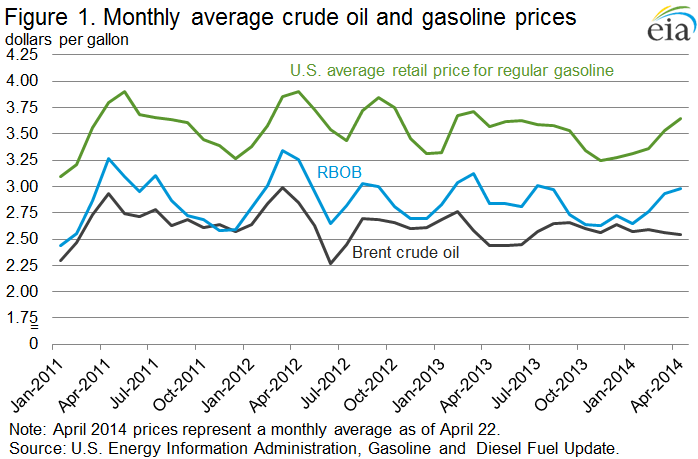
Changes in the price of retail gasoline result from changes in both the price of crude oil and wholesale gasoline crack spreads. Crude oil prices do not display a seasonal pattern. Crack spreads for gasoline, however, are very seasonal. Over the past five years, gasoline crack spreads (measured here as the difference between the Nymex prompt RBOB futures contract and the spot price of North Sea Brent crude oil) have typically been flat in January and February, averaging 17 cents/gal during those months. Then they have generally increased, peaking in May at an average of 35 cents/gal. This post-February increase is largely related to typical seasonal factors such as refinery maintenance, increasing demand from driving, and the switch to summer-grade gasoline, which is more costly to produce than winter-grade gasoline. Crack spreads then typically decline as those factors moderate, reaching the low point for the year during the fourth quarter. The previous five-year average crack spread during the fourth quarter was 10 cents/gal.
For the past three years, retail gasoline price increases during the first half of the year were largely related to crude oil price increases in the first quarter. Because the crude oil price increases occurred just before or concurrent with crack spread increases, the related gasoline price increases were conflated with the effects of seasonal movements in crack spreads. Last year, February marked the high point for the monthly average Brent price at $116 per barrel (bbl), contributing to the peak retail price of $3.78/gal on February 25. Likewise, in both 2011 and 2012 crude oil prices increased sharply from January through the end of the first quarter. These rising crude prices pushed 2011 retail gasoline prices to a peak of $3.97/gal on May 9 and 2012 prices to a peak of $3.94/gal on April 2. In both years, crack spreads generally held true to typical seasonal patterns.
In 2014, crude oil prices have been stable by comparison. This crude oil price stability suggests that crack spreads have been the main driver of gasoline price increases. The 2014 increase in crack spreads has been steeper than in recent years. This is partially attributable to crack spreads in January and February that averaged 12 cents/gal, 5 cents lower than the five-year average. The low spreads in the first two months of the year were likely related to reduced driving as a result of severe winter weather in many parts of the country. Crack spreads have since risen to an April average to date of 44 cents/gal, 11 cents/gal more than the five-year average for the month. This year´s increase is likely a result of demand temporarily outpacing supply, as refineries are down for maintenance and driving begins to ramp up towards summer. Additionally, data in late 2013 appear to indicate that gasoline demand was beginning to recover structurally because of improving employment conditions and higher economic growth. Current inventory is evidence of this trend. After reaching 235.3 million bbl on January 17 (8.2 million bbl above the five-year average for that week), total U.S. gasoline inventories have since fallen to 210.0 million bbl, 6.0 million bbl below the five-year average.
Because the United States is tied to the global gasoline market, both as an importer and exporter of gasoline, the U.S. gasoline price reflects international benchmark Brent crude oil and opportunities for product arbitrage. While exports of gasoline from the Gulf Coast (PADD 3) have risen in recent years, the United States still imports significant quantities of gasoline, particularly into the East Coast (PADD 1). Because of capacity-constrained pipelines and the relatively high cost of shipments using coastal tankers, incremental supply in the Gulf Coast gasoline market often cannot be economically transferred to the East Coast. With the East Coast remaining a large importer, that region´s marginal barrel of gasoline comes from Europe or, at times, India, where gasoline prices reflect the price of Brent.
However, the Gulf Coast´s status as a major gasoline exporter provides an attractive source of supply for global markets. Given existing transportation constraints in the United States, supplying overseas markets with product from economically efficient Gulf Coast refineries also helps balance global gasoline supply/demand, which in turn helps the import-dependent East Coast. Without export markets for petroleum products, U.S. refineries would lose a source of demand, likely causing decreasing supplies available to the market either through refinery closures or decreased crude oil throughputs. Notably, gasoline exports typically peak in the fourth quarter, when U.S. demand for gasoline is lowest. The fourth-quarter increase in exports often coincides with the seasonal low point in gasoline crack spreads.
Gasoline and diesel fuel prices increase
The U.S. average price for regular gasoline increased three cents to $3.68 per gallon as of April 21, 2014, 15 cents more than the same time last year, and the highest average price since March 18, 2013. The East Coast and West Coast prices both increased five cents, to $3.66 and $4.03 per gallon respectively. Prices on the Gulf Coast increased two cents to $3.49 per gallon. The Rocky Mountain and Midwest prices were both up by a penny, to $3.45 and $3.64 per gallon respectively.
The U.S. average diesel fuel price rose two cents to $3.97 per gallon, eight cents higher than the same time last year. The West Coast price increased five cents to $4.03 per gallon. The Rocky Mountain and Gulf Coast prices both increased three cents, to $3.98 and $3.82 per gallon respectively. Midwest prices increased by a penny to $3.95 per gallon, while those on the East Coast increased by less than a penny to remain at $4.70 per gallon.
Propane inventories gain
U.S. propane stocks increased by 1.2 million barrels last week to 29.5 million barrels as of April 18, 2014, 9.4 million barrels (24.2%) lower than a year ago. Midwest inventories increased by 0.9 million barrels. East Coast, Gulf Coast and Rocky Mountain/West Coast inventories each increased by 0.1 million barrels respectively. Propylene non-fuel-use inventories represented 10.5% of total propane inventories.
Text from the previous editions of This Week In Petroleum is accessible through a link at the top right-hand corner of this page.
 |
 |
||||||
| Retail Data | Change From Last | Retail Data | Change From Last | ||||
| 04/21/14 | Week | Year | 04/21/14 | Week | Year | ||
| Gasoline | 3.683 | Diesel Fuel | 3.971 | ||||
 |
 |
||||||||||||||||||||||||||
|
 |
||||||||||||||||||||||||||
| *Note: Crude Oil Price in Dollars per Barrel. Markets were closed on 4/18/2014. |
|||||||||||||||||||||||||||
 |
 |
||||||
 |
 |
||||||
| Stocks Data | Change From Last | Stocks Data | Change From Last | ||||
| 04/18/14 | Week | Year | 04/18/14 | Week | Year | ||
| Crude Oil | 397.7 | Distillate | 112.5 | ||||
| Gasoline | 210.0 | Propane | 29.527 | ||||