Released: March 5, 2014
Next Release: March 12, 2014
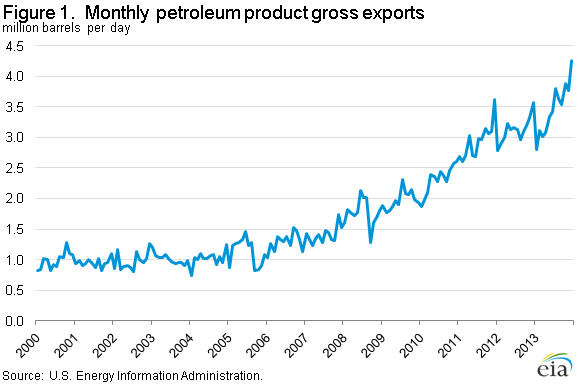
Petroleum Product Exports Continued to Rise in 2013
Gross exports of petroleum products from the United States reached 4.3 million barrels per day (bbl/d) in December 2013, the first time exports exceeded 4 million bbl/d in a single month (Figure 1). December exports cap a year of steady growth and bring average exports for full-year 2013 to 3.5 million bbl/d, 350,000 bbl/d (11%) higher than in 2012 (Figure 2). The increase in exports was broad-based, affecting multiple products.
Average distillate fuel gross exports exceeded 1.1 million bbl/d in 2013, a 110,000-bbl/d increase over the 2012 level. Cost-advantaged domestic crude oil and natural gas feedstock encouraged near-record-high refinery runs, and 2013 distillate production increased 160,000 bbl/d compared with 2012. For the year, U.S. refiners produced an average 4.7 million bbl/d of distillate fuel, and during December produced 5.1 million bbl/d, a record since EIA began collecting those data. The strongest absolute growth in distillate exports last year was to Central and South America, already the largest destination for U.S.-produced distillate fuel. U.S. exports to that region increased 60,000 bbl/d to 550,000 bbl/d. Exports to Western Europe increased by 50,000 bbl/d to average 400,000 bbl/d.
Exports of gasoline, jet fuel and pentanes plus, a mixture of liquid hydrocarbons that is similar to natural gasoline and extracted from natural gas in a gas processing plant, also increased in 2013. Gasoline exports, which include finished gasoline and gasoline blending components, increased 45,000 bbl/d in 2013, averaging 550,000 bbl/d for the year. December gasoline exports set a monthly record of 770,000 bbl/d.

Propane gross exports averaged 300,000 bbl/d in 2013, a 130,000-bbl/d increase over the 2012 level. In 2013, gas plant propane production increased 100,000 bbl/d and refinery propane production increased 10,000 bbl/d, respectively, compared to 2012. The 110,000 bbl/d of propane production growth exceeded domestic consumption growth of 90,000 bbl/d and helped fuel the increase in exports. Propane export growth was strongest in the fourth quarter following the September expansion of the Targa Resources export terminal near Houston. Almost half of all 2013 propane exports were to Central and South America. Propane exports to Western Europe grew strongly on a percentage basis, more than doubling from 2012 levels to 55,000 bbl/d last year.
EIA estimates that from 2008 through 2013, global consumption of petroleum products excluding the United States increased 6.5 million bbl/d (7.6%), during a period when U.S. petroleum product consumption was generally declining. Since 2008, exports of petroleum products from the United States have increased 1.7 million bbl/d, supplying about 25% of the growth in petroleum product demand outside of the United States. About 75% of U.S. product exports leave from the Gulf Coast (USGC), home to about half the country's refining capacity. Close proximity to Latin America has long enabled USGC refineries to competitively supply products to that region. More recently, with limited additional opportunity to economically supply other regions of the United States and with Latin American exports already at high levels, USGC production is moving to more distant markets. Exports of petroleum products from the USGC to Africa, as well as Asia and Oceania, increased by 56,000 bbl/d (81%) and 97,000 bbl/d (44%), respectively, in 2013.
At the same time, the United States continues to import significant amounts of petroleum products (2.1 million bbl/d on average in 2013). However, imports are generally declining, and since mid-2011, the United States consistently has been a net petroleum product exporter. In 2013, net exports reached record levels both on average for full-year 2013 (1.4 million bbl/d) and in December (2.5 million bbl/d). The United States is now a net exporter of most products, with the exceptions of gasoline and unfinished oils, which are intermediate products further processed by refineries to produce finished products. Imports are important in regionally and seasonally balancing supply and demand in the United States. Although the Gulf Coast is a large net exporter of gasoline, the East Coast continues to import substantial amounts of gasoline. Given existing infrastructure constraints, it is generally more economical for the East Coast to import gasoline, mostly from Europe and Canada. During most of the year, East Coast imports of gasoline cause the United States to be a net importer of gasoline. However, during periods of low gasoline demand in the United States, such as November and December, the United States has shifted to become a net gasoline exporter in recent years. Likewise, imports play a critical role in supplying distillate and propane during the winter, particularly on the East Coast, when local refinery and gas plant production, along with shipments from other regions, are insufficient to meet increases in demand.
Outlook for Refinery Outages and Available Refinery Capacity in the First Half of 2014
EIA has resumed regular semiannual reporting on refinery outages and their potential implications for available refinery capacity and petroleum product markets. EIA believes dissemination of such analyses can be beneficial to market participants who may otherwise be unable to access information regarding planned refinery outages.
This report uses the same analytical approach and the same data sources as in previous semiannual EIA reports on refinery outages beginning in 2008, up to and including Market Assessment of Refinery Outages issued in April 2011. Like prior reports, this report considers the adequacy of available refinery capacity to produce middle distillate (diesel, jet fuel, and heating oil) and gasoline to meet forecast demand for petroleum products, focusing on two refinery units, the crude distillation unit (CDU) and the fluid catalytic cracking unit (FCCU), that are most strongly correlated with distillate and gasoline production, respectively. The report estimates available refinery capacity using data on operable refinery capacity, planned refinery unit outages and historical average unplanned outages.
Gasoline price up while diesel fuel stays flat
The U.S. average retail price of regular gasoline increased four cents to $3.48 per gallon as of March 3, 2014, 28 cents lower than last year at this time. The Rocky Mountain price was $3.39, up seven cents from last week. The Midwest and West Coast prices both gained six cents, to $3.50 per gallon and $3.71 per gallon, respectively. On the Gulf Coast the price was $3.23 per gallon, two cents more than last week, and the East Coast price was a penny higher at $3.47 per gallon.
The national average diesel fuel price was down less than a penny to remain at $4.02 per gallon, 11 cents lower than last year at this time. The Rocky Mountain price increased three cents to $3.98 per gallon and the East Coast price was a penny higher at $4.16 per gallon. On the West Coast, the price gained a fraction of a cent to remain at $4.04 per gallon. Prices on the Gulf Coast and in the Midwest both decreased one cent, to $3.79 per gallon and $4.02 per gallon, respectively.
Propane inventories rise
U.S. propane stocks rose by 0.5 million barrels to end at 27.2 million barrels last week, 18.5 million barrels (40.5%) lower than a year ago. Gulf Coast inventories led the gain, rising by 0.6 million barrels, and East Coast inventories increased by 0.3 million barrels. Midwest inventories decreased by 0.4 million barrels, while Rocky Mountain/West Coast inventories remained nearly unchanged. Propylene non-fuel-use inventories represented 12.6% of total propane inventories.
Residential heating oil and propane prices decrease
Residential heating oil prices decreased almost 2 cents per gallon to reach a price of nearly $4.23 per gallon during the period ending March 3, 2014. This is 15 cents per gallon higher than last year's price at this time. Wholesale heating oil prices fell by less than 4 cents per gallon last week to nearly $3.36 per gallon.
The average residential propane price decreased by almost 18 cents per gallon last week to $3.30 per gallon, less than 99 cents per gallon higher than the same period last year. Wholesale propane prices decreased by 33 cents per gallon to almost $1.51 per gallon as of March 3, 2014.
Text from the previous editions of This Week In Petroleum is accessible through a link at the top right-hand corner of this page.
 |
 |
||||||
 |
 |
||||||
| Retail Data | Change From Last | Retail Data | Change From Last | ||||
| 03/03/14 | Week | Year | 03/03/14 | Week | Year | ||
| Gasoline | 3.479 | Heating Oil | 4.226 | ||||
| Diesel Fuel | 4.016 | Propane | 3.302 | ||||
 |
 |
||||||||||||||||||||||||||
|
 |
||||||||||||||||||||||||||
| *Note: Crude Oil Price in Dollars per Barrel. | |||||||||||||||||||||||||||
 |
 |
||||||
 |
 |
||||||
| Stocks Data | Change From Last | Stocks Data | Change From Last | ||||
| 02/28/14 | Week | Year | 02/28/14 | Week | Year | ||
| Crude Oil | 363.8 | Distillate | 114.5 | ||||
| Gasoline | 229.0 | Propane | 27.155 | ||||