Released: November 20, 2013
Next Release: November 27, 2013
EPA proposes 2014 Renewable Fuel Standard, with EIA to provide input to the final rule
On November 15, 2013, the Environmental Protection Agency (EPA) released its Notice of Proposed Rulemaking for the 2014 Renewable Fuel Standard (RFS). The RFS program, established by the Energy Policy Act of 2005 and later expanded by the Energy Independence and Security Act of 2007 (EISA07), requires EPA to set annual requirements for the renewable content of liquid fuels that may differ from a set of targets specified by law. The Energy Information Administration (EIA) is required by the RFS provisions in EISA07 to provide EPA with information related to the projected use of motor gasoline and diesel fuel and the supply of various categories of biofuels in the month before issuance of EPA's final RFS rulemaking for each program year.
While EPA has set requirements for cellulosic biofuels well below the legislated volume targets for such fuels in past RFS program years, the proposed rule for the 2014 RFS program is the first time that the agency is seeking to set total renewable fuel and advanced biofuel requirements below the legislated targets (Table 1).
| Legislated 2013 | Final 2013 | Legislated 2014 | Proposed 2014 | |
|---|---|---|---|---|
| Cellulosic biofuel | 1.0 | 0.006 | 1.75 | 0.017 |
| Biomass-based diesel (billion gallons) | ≥1.0 | 1.28 | ≥1.0 | 1.28 |
| Advanced biofuel | 2.75 | 2.75 | 3.75 | 2.2 |
| Renewable fuel | 16.55 | 16.55 | 18.15 | 15.21 |
| Source: U.S. Energy Information Administration. | ||||
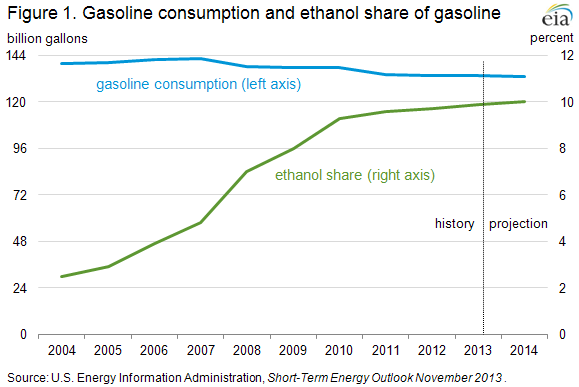
The pool of gasoline available for ethanol blending is significantly smaller than it was projected to be before enactment of EISA07, which in addition to updating RFS program requirements also mandated significant increases in vehicle fuel economy standards. The total demand for gasoline has been flat or decreasing since 2007 because of greenhouse gas and fuel economy standards for vehicles, fuel prices, and a sharp economic downturn followed by a slow recovery. In summer 2006, when the reference case for EIA's Annual Energy Outlook 2007 (AEO2007) was developed, the projected 2014 total gasoline energy demand (including ethanol) was 153.9 billion gallons. This gasoline pool could have absorbed 15.4 billion gallons of ethanol if all gasoline was E10. By summer 2012, when the AEO2013 reference case was developed, the comparable estimated total gasoline energy demand was 131.9 billion gallons. This gasoline pool could absorb 13.1 billion gallons ethanol if all gasoline was E10.
EIA's most current projections for motor fuel use are presented in the Short-term Energy Outlook (STEO), which is updated monthly. The forecast of 2014 motor fuel use that EIA will provide to EPA for use in translating the RFS requirements it decides upon into renewable volume obligation percentages for obligated parties under the RFS program will be based on the latest available STEO forecast at the time EIA provides its input. As shown in Figure 1, the November 2013 STEO projects gasoline energy demand of 133.2 billion in 2014, including 13.35 billion gallons of ethanol by volume. This estimate is about 1.0% higher than the AEO2013 reference case projection for 2014. The November 2013 STEO projects petroleum diesel consumption of 55.3 billion gallons in 2014.
Forecasts of motor fuels use over the coming year generally move with the outlook for economic conditions, prices, and any changes in regulations. However, as noted in EIA's May 2013 letter to EPA providing input in advance of the 2013 RFS final rule, forecasting cellulosic ethanol supply can be quite challenging. While cellulosic biofuel production estimates are subject to much smaller absolute uncertainty than production or consumption estimates for other transportation fuels, the percentage uncertainty surrounding forecasts of cellulosic fuels is very large. This reflects both the very low volume of total cellulosic biofuel production and the very small number of facilities that have begun to enter into service. Small changes in the startup date or projected utilization rate at just one facility can therefore have a large effect on the total amount of cellulosic biofuel production that is achieved. This is different from many other EIA production forecasts where production occurs from a very large number of plants, which allows for averaging of outage rates at individual facilities, and for which start-up of a new facility has very little impact on the total production.
An additional challenge for forecasts of cellulosic supply during 2014 is that EPA is currently considering the approval of several new pathways (the combination of feedstocks and conversion methodology) for fuels that could affect the availability of certain types of biofuels. As it prepares to provide its input to EPA ahead of the final RFS rule for 2014, EIA will be carefully watching for new information regarding the situation with respect to individual facilities and possible action by EPA regarding new pathways over the coming months.
Gasoline price up while the diesel fuel price declines
The U.S. average retail price of regular gasoline increased three cents to $3.22 per gallon as of November 18, 2013, 21 cents lower than last year at this time. Prices fell four cents in the Rocky Mountains and the West Coast, to $3.18 per gallon and $3.47 per gallon, respectively, but increased in all other regions. The largest increase came in the Midwest, where the price was up five cents to $3.13 per gallon. On the East Coast the price was $3.28 per gallon, a gain of four cents from last week, and the Gulf Coast price rose three cents to $3.00 per gallon.
The national average diesel fuel price fell one cent to $3.82 per gallon, 15 cents lower than last year at this time, and the lowest price since July 1, 2013. Prices fell in all regions of the nation except the Rocky Mountains, where the price was unchanged from last week at $3.84 per gallon. The West Coast price was two cents lower at $3.95 per gallon, and the East and Gulf Coast prices decreased one cent, to $3.84 per gallon and $3.75 per gallon, respectively. The Midwest price was down less than a penny to $3.79 per gallon.
Propane inventories fall
U.S. propane stocks fell by 2.4 million barrels to end at 58.4 million barrels last week, 14.3 million barrels (19.7%) lower than a year ago. Gulf Coast regional inventories dropped by 1.8 million barrels. Both Midwest and East Coast inventories decreased by 0.3 million barrels, while Rocky Mountain/West Coast region were unchanged from previous week. Propylene non-fuel-use inventories represented 5.2% of total propane inventories.
Heating fuel prices increase
Residential heating oil prices increased by nearly a cent per gallon last week during the period ending November 18, 2013 to $3.82 per gallon. This is nearly 18 cents per gallon lower than the price at the same time last year. Wholesale heating oil prices increased by 5 cents per gallon to $3.04 per gallon.
The average residential propane price increased by 2 cents per gallon last week to $2.50 per gallon, almost 27 cents per gallon higher than the same period last year. Wholesale propane prices increased by 3 cents per gallon to $1.41 per gallon as of November 18, 2013.
Text from the previous editions of This Week In Petroleum is accessible through a link at the top right-hand corner of this page.
 |
 |
||||||
 |
 |
||||||
| Retail Data | Change From Last | Retail Data | Change From Last | ||||
| 11/18/13 | Week | Year | 11/18/13 | Week | Year | ||
| Gasoline | 3.219 | Heating Oil | 3.822 | ||||
| Diesel Fuel | 3.822 | Propane | 2.504 | ||||
 |
 |
||||||||||||||||||||||||||
|
 |
||||||||||||||||||||||||||
| *Note: Crude Oil Price in Dollars per Barrel. | |||||||||||||||||||||||||||
 |
 |
||||||
 |
 |
||||||
| Stocks Data | Change From Last | Stocks Data | Change From Last | ||||
| 11/15/13 | Week | Year | 11/15/13 | Week | Year | ||
| Crude Oil | 388.5 | Distillate | 112.5 | ||||
| Gasoline | 208.9 | Propane | 58.372 | ||||