Released: October 2, 2013
Next Release: October 9, 2013
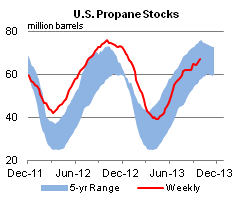
New production sources change domestic propane flows
Increasing domestic oil and gas production is changing the flow of propane in the United States. Propane, which many people think about only when turning on an outdoor grill, has many uses for petrochemical production, agriculture, and space heating, among others. Propane has historically moved in large volumes from the Gulf Coast (PADD 3), where much propane is produced and stored, to other regions in the United States to meet seasonal increases in winter space heating demand. More recently, increased propane supply in conjunction with natural gas and oil production from shale resources throughout the country has made it possible to meet a growing share of regional demand from in-region sources. This has decreased the need to transport propane from the Gulf Coast to other regions, and increased the flow of propane from new centers of production in the Midwest (PADD 2) and the East (PADD1) to the Gulf Coast's petrochemical demand centers, processing and storage infrastructure, and ports for shipment to global markets.
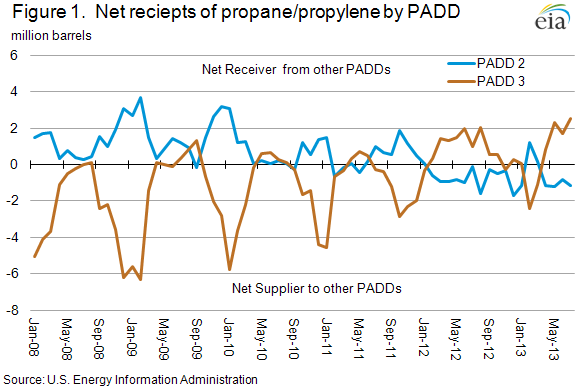
The use of propane as a heating fuel results in increased consumption during the winter (October-March). The seasonal variation in demand is regionally most evident in the Midwest, where over the past five years winter consumption has averaged 114% more than consumption in summer months (April-September). Before 2011, the large seasonal increase in Midwest demand was met with increased supply from the Gulf Coast (Figure 1). The East Coast was also supplied regularly by the Gulf Coast.
Growing production of both wet natural gas and light crude oil has increased the supply of propane. On the East Coast, increased propane production is associated with the development of the Marcellus Shale play. In the Midwest, rising propane production has been associated with shale gas development in the Woodford formation in Oklahoma and Bakken oil production in North Dakota. In the Rocky Mountains (PADD 4), there has been significant growth in propane supply from natural gas production in the Niobrara, Granite Wash, and other formations. And in the Gulf Coast region, propane production has grown as more light crude oil and wet gas are produced from the Eagle Ford formation.
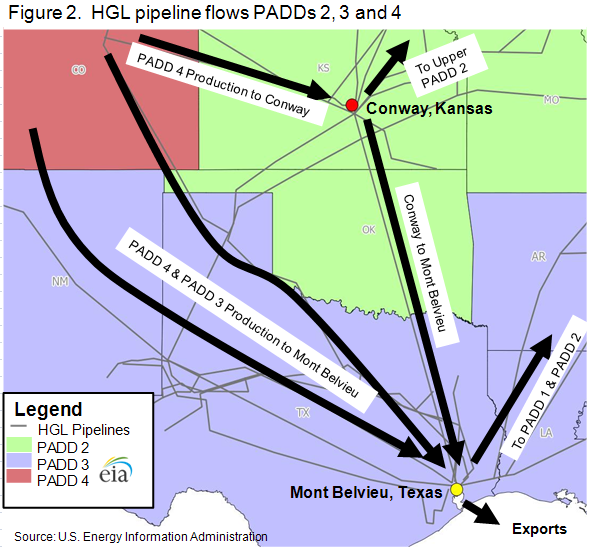
With these production changes, propane supply flows within the United States have also changed. Propane from the Midwest is now moving south to the Gulf Coast to supply petrochemical demand and to gain access to the global market (Figure 2). The petrochemical industry on the Gulf Coast, along with substantial propane and other hydrocarbon gas liquids (HGL) storage infrastructure, is centered around Houston, Texas; Mont Belvieu, Texas; and Hattiesburg, Mississippi. Trade press reports indicate that the increased availability of propane and other feedstocks is supporting recent large investments in new and expanded petrochemical and HGL processing facilities.
At the HGL hub of Conway, Kansas, which has 7% of the nation's propane storage, there has been an increase in pipeline capacity to receive propane from the Rockies and to send it south to the Gulf Coast. Before southbound capacity increased, prices for propane at Conway were cheaper than Gulf Coast prices at Mont Belvieu, which hosts half of the nation's propane storage. For the first six months of 2012, the spot price of propane at Mont Belvieu averaged 23 cents per gallon above the price at Conway. By the end of August 2012, the spread had declined to 10 cents per gallon. Thus far in 2013, the spread between Mont Belvieu and Conway has remained tight, averaging 4 cents per gallon.
The increase in overall propane supply has made U.S. propane exports more price-competitive in markets around the globe. Continued expanding capacity to export propane from locations such as Houston means that the Gulf Coast will continue to receive propane from other PADDs when the price differentials have narrowed, as is the case today.
Gasoline falls for a 4th week; diesel down the last three
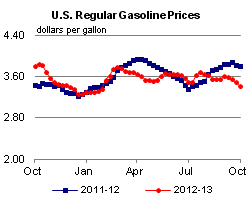
The U.S. average retail price of regular gasoline decreased seven cents to $3.43 per gallon as of September 30, 2013, 38 cents lower than last year at this time, and the lowest price since January 28, 2013. Prices were down in all regions of the nation, with the largest decrease coming in the Midwest, where the price lost 11 cents to $3.35 per gallon. The Gulf and West Coast prices were $3.18 per gallon and $3.80 per gallon, respectively, down six cents from last week. On the East Coast, the price was $3.41 per gallon, five cents less than last week, and the Rocky Mountain price was four cents lower at $3.55 per gallon.
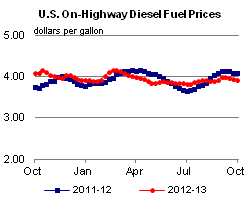
The national average diesel fuel price decreased three cents for a second consecutive week, to $3.92 per gallon, 16 cents lower than last year at this time. Prices decreased in all regions of the nation, with both the Midwest and West Coast prices dropping four cents, to $3.89 per gallon and $4.08 per gallon, respectively. On the East and Gulf Coasts, the price was $3.93 per gallon and $3.83 per gallon, respectively, both three cents lower than last week, and the Rocky Mountain price fell two cents to $3.93 per gallon.
Propane stocks increase
Total U.S. inventories increased by 1.6 million barrels last week to end at 67.0 million barrels, about 8.6 million barrels (11.3%) lower than the same week last year. Gulf Coast inventories led the gain with 0.6 million barrels of new stocks. The East Coast and Midwest regions each grew by 0.4 million barrels, and the Rocky Mountain/West Coast stocks added 0.2 million barrels. Propylene non-fuel-use inventories represented 4.7% of total propane inventories.
Text from the previous editions of This Week In Petroleum is accessible through a link at the top right-hand corner of this page.
 |
 |
||||||
| Retail Data | Change From Last | Retail Data | Change From Last | ||||
| 09/30/13 | Week | Year | 09/30/13 | Week | Year | ||
| Gasoline | 3.425 | Diesel Fuel | 3.919 | ||||
 |
 |
||||||||||||||||||||||||||
|
 |
||||||||||||||||||||||||||
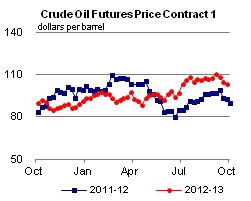
| *Note: Crude Oil Price in Dollars per Barrel. | |||||||||||||||||||||||||||
 |
 |
||||||
 |
 |
||||||
| Stocks Data | Change From Last | Stocks Data | Change From Last | ||||
| 09/27/13 | Week | Year | 09/27/13 | Week | Year | ||
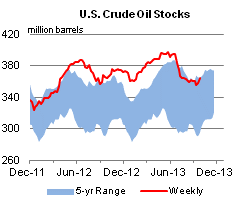
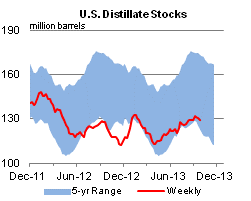
| Crude Oil | 363.7 | Distillate | 129.2 | ||||
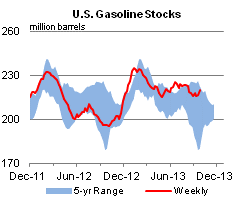
| Gasoline | 219.7 | Propane | 67.025 | ||||