Released: September 5, 2013
Next Release: September 11, 2013
What is Driving the Declining U.S. Gasoline Consumption?
The Labor Day holiday marked the end of the peak driving season, a good occasion to review the most recent data on gasoline consumption, which accounts for almost 10% of global liquid fuels consumption. For the first half of 2013, EIA data show gasoline consumption lower than the comparable 2012 period by 50,000 barrels per day (bbl/d), or 0.6%, lower than in the comparable 2012 period (Figure 1). Economic growth, gasoline prices, and vehicle fleet efficiency are key determinants of gasoline use. So far in 2013, year-over-year economic growth and slightly lower retail gasoline prices, a combination that would generally lead to increased gasoline consumption, have been more than offset by the increased fuel efficiency of the light-duty vehicle fleet.
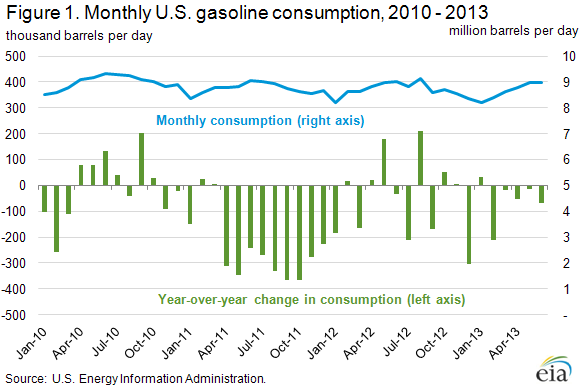
The gasoline consumption trend through first-half 2013 was largely a continuation of the trend observed in 2012, when gasoline consumption also fell about 50,000 bbl/d compared to 2011. This average decline in consumption of about 50,000 bbl/d represents a more moderate pace of demand deterioration than in 2011, when significant price increases as a result of Libyan crude oil production outages were the main impetus behind an average 240,000-bbl/d decline in consumption compared with 2010. Since the beginning of 2011, gasoline consumption has declined year-over-year in 21 of the 30 months for which EIA has published monthly data.
The net effect of the income, price, and fuel efficiency impacts as modeled by EIA yields a decline in gasoline consumption of 0.8%, which is roughly consistent with the 0.6% year-over-year decline observed for January through June 2013.
Real gross domestic product (GDP) for the first six months of 2013 is estimated to be 1.7% higher than for the same period in 2012. According to EIA's Short-Term Energy Outlook (STEO) model, the short-term income elasticity for vehicle miles traveled is about 0.6 (meaning a 1% increase in income results in a 0.6% increase in miles traveled). This elasticity estimate suggests that motor gasoline consumption should have been 1.0% higher this year than in the same period in 2012, assuming no year-over-year change in gasoline prices or fuel efficiency of the vehicle fleet.
In its STEO model, EIA estimates the short-term elasticity of vehicle miles traveled with respect to the price of gasoline to be about -0.04 (a 1.0% increase in prices leads to a 0.04% decline in highway travel). The average pump price of regular-grade gasoline during the first six months of 2013 was 2.1% lower than the same period last year. Motor gasoline consumption would therefore have been 0.1% higher than in 2012, assuming no year-over-year change in economic activity or improvement in the average efficiency of the vehicle fleet.
Combined, the estimated net effect of income and price changes and their respective elasticity estimates during the first half of 2012 imply a 1.1% increase in gasoline consumption over the comparable year-ago period.
However, based on EIA estimates of the light-duty vehicle fleet's fuel efficiency improvements from 2012 to 2013, the implied average fuel efficiency of the in-use light-duty vehicle fleet rose by 1.9% in the first half of 2013 compared with the comparable year-ago period. Efficiency gains likely reflect both the more stringent Corporate Average Fuel Economy (CAFE) standards, which were implemented for light-duty trucks starting in model year 2008 and for passenger cars starting in model year 2011, and consumer vehicle choice in an era of higher gasoline prices.
Gasoline and Diesel Fuel Prices Both Increase
The U.S. average retail price of regular gasoline increased six cents to $3.61 per gallon as of September 2, 2013, 24 cents lower than last year at this time. Prices were up in all regions of the country with the largest increase coming in the Midwest, where the price grew by 11 cents to $3.63 per gallon to mark the largest one-week increase since July 15, 2013. The East Coast price was $3.61 per gallon, an increase of five cents from last week. Increasing two cents from last week, the Gulf Coast price was $3.41 per gallon. The West Coast price rose half a cent but remained at $3.75 per gallon and the Rocky Mountain region had the smallest gain of less than a penny to $3.63 per gallon.
The national average diesel fuel price increased seven cents to $3.98 per gallon, 15 cents lower than last year at this time. Prices increased in all regions of the nation with the largest increase in the Midwest where the price rose eight cents to $3.97 per gallon, the highest price since April 1, 2013. Prices increased seven cents on the East Coast and the Gulf Coast to $3.99 per gallon and $3.90 per gallon, respectively. The West Coast price was $4.13 per gallon, a gain of six cents from last week. Rounding out the regions, the Rocky Mountain price moved up a penny to $3.94 per gallon.
Propane Stocks Show a Large Build
Total U.S. propane inventories increased by 2.5 million barrels last week to end at 64.6 million barrels, about 7.9 million barrels (10.9%) lower than the same week last year. Gulf Coast stocks rose 1.4 million barrels and Midwest stocks were up 1.0 million barrels. East Coast and Rocky Mountain/West Coast inventories each grew by 0.6 million barrels. Propylene non-fuel-use inventories represented 4.4% of total propane inventories.
Text from the previous editions of This Week In Petroleum is accessible through a link at the top right-hand corner of this page.
 |
 |
||||||
| Retail Data | Change From Last | Retail Data | Change From Last | ||||
| 09/02/13 | Week | Year | 09/02/13 | Week | Year | ||
| Gasoline | 3.608 | Diesel Fuel | 3.981 | ||||
 |
 |
||||||||||||||||||||||||||
|
 |
||||||||||||||||||||||||||
| *Note: Crude Oil Price in Dollars per Barrel. | |||||||||||||||||||||||||||
 |
 |
||||||
 |
 |
||||||
| Stocks Data | Change From Last | Stocks Data | Change From Last | ||||
| 08/30/13 | Week | Year | 08/30/13 | Week | Year | ||
| Crude Oil | 360.2 | Distillate | 129.6 | ||||
| Gasoline | 216.0 | Propane | 64.614 | ||||