Released: August 21, 2013
Next Release: August 28, 2013
EIA Expects Brent Prices to Decline through End of 2013 Despite Current Supply Disruptions
Last weekend, many soccer fans in the United Kingdom and elsewhere focused their attention on the start of the new season of the Barclays Premier League (BPL), one of the top leagues in the world. But the BPL opening day was not the only item of global interest in the United Kingdom. Petroleum analysts throughout the world also noticed recent increases in the price of Brent crude oil.
Disruptions to global crude oil and liquid fuels production reached nearly 2.7 million barrels per day (bbl/d) in July 2013 (Figure 1), the highest level since at least January 2009. During this same period, global refinery crude oil runs reached their expected 2013 peak. Combined, these developments helped push Brent spot prices to an average of $108 per barrel in July, above the $102-$103-per-barrel average from April through June.
However, this upward price movement was likely muted in part by growing non-OPEC supply in other regions, including growing U.S. production that has reduced U.S. imports of crude oil and in so doing released more barrels from global suppliers to other markets. Through the end of the third quarter and into the fourth quarter, EIA expects that continued rising non-OPEC production combined with seasonally decreasing demand from refiners will put downward pressure on Brent prices. In the August Short-Term Energy Outlook (STEO), EIA projects the Brent spot price will average $104 per barrel in September, and $102 per barrel in the fourth quarter.
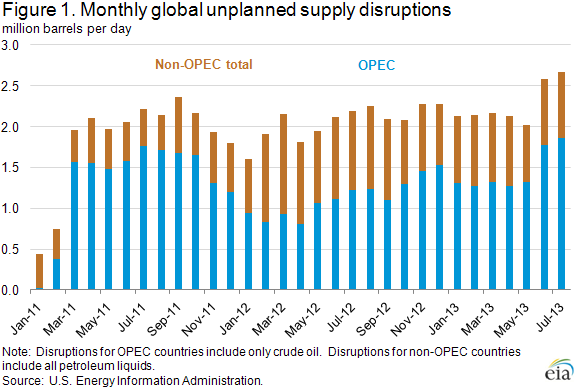
Disruptions to production in Iraq and Libya have had a significant effect over the summer, reducing crude supplies, particularly into the Mediterranean market, an important market for Brent-priced crude oils. In Iraq, persistent attacks on the pipeline from Kirkuk to Ceyhan in Turkey helped push total Iraqi production disruptions to about 290,000 bbl/d in July, up 60,000 bbl/d from June. In Libya, ongoing labor-related protests at several oil production facilities boosted outages, thereby reducing production to 1.0 million bbl/d in July, down from 1.5 million bbl/d in April. Additional deterioration in the security environment in Iraq or Libya could further reduce OPEC production in the short term. In Nigeria, crude exports were reduced during July and August as deliveries of the country's Bonny Light grade were disrupted by work on key pipelines.
Outages in non-OPEC member countries as well as record-high global refinery runs also tightened crude supplies and contributed to higher crude oil prices. The International Energy Agency (IEA) reported that global refinery runs were 78.3 million bbl/d in July, up from an average of 74.8 million bbl/d in the second quarter. The IEA expects global runs to remain at a fairly hefty 77.4 million bbl/d in August. From a supply standpoint, disruptions to non-OPEC production averaged about 800,000 bbl/d, most of which occurred in Sudan and South Sudan, Yemen, and Syria, and which were largely already priced into market expectations. However, unanticipated flood-related disruptions in Canada, mostly affecting North American inland markets, contributed almost a quarter of the total non-OPEC outages.
The tightness in light sweet crude oil supply resulting from the combination of production outages and increased refinery runs is most readily apparent in the absolute price levels of Brent crude oil. However, it is also evident in the Urals differential, the price of Urals crude oil compared with that of Brent. Urals, a Russian crude oil, competes in European markets with many Brent-priced crude oils. The Urals differential for crude oil delivered into the Mediterranean market moved from an average $0.48 per barrel below Brent in June to an increasingly larger premium to Brent for much of July and the first weeks of August, reaching a $2.76-per-barrel premium versus Brent on August 8. The Urals price was also supported by high refinery runs in the former Soviet Union, mostly Russia, which increased from 6.2 million bbl/d in April to 7.1 million bbl/d in August, reducing supplies available for export.
In September, an expected reduction in refinery purchases of crude oil should help to relieve upward pressure on prices even as production outages continue. The IEA expects global crude oil runs to fall to 76.2 million bbl/d in September and to 75.9 million bbl/d in October. As refiners typically schedule crude purchases one to two months in advance of actual processing, short-term refiner demand for crude is likely to taper off. Likewise, EIA projects non-OPEC liquid fuels production, predominantly crude oil, will increase through the end of 2013, with fourth-quarter production averaging 55.0 million bbl/d, increases of 0.7 million bbl/d and 1.3 million bbl/d from the third and second quarters of 2013, respectively.
While crude oil prices have drifted modestly upwards in August, with Brent trading at about $110 per barrel on August 21, it is likely that reduced crude buying has blunted the continued effects of production outages. This is already evident in the Urals differential in the Mediterranean, where Urals is again trading at a discount to Brent. Yet, there is still uncertainty in the price forecast. Trade press has reported recently that labor strife in Libya has yet to subside and that maintenance at the port of Basra could further reduce Iraqi exports in September, though such reports have been disputed by the Iraqi government. Any increase in production outages could put upward pressure on Brent prices. At the moment, however, EIA expects reduced refinery demand and rising supply to largely offset existing outages and bring Brent prices within the $102-$104-per-barrel range, closer to levels seen earlier in 2013.
Gasoline price decreases while diesel fuel increases
The U.S. average retail price of regular gasoline decreased one cent to $3.55 per gallon as of August 19, 2013, 19 cents lower than last year at this time. Prices decreased in all regions except the Midwest, where the price increased two cents to $3.50 per gallon. The largest decrease came on the West Coast, where the price fell six cents to $3.78 per gallon. The East and Gulf Coast prices both fell two cents, to $3.55 per gallon and $3.37 per gallon, respectively. Rounding out the regions, the Rocky Mountain price declined a penny to $3.64 per gallon.
The national average diesel fuel price increased less than one cent to remain at $3.90 per gallon, 13 cents lower than last year at this time. Prices increased one cent in both the Midwest and on the West Coast, to $3.87 per gallon and $4.06 per gallon, respectively. On the East Coast, diesel fuel remains at $3.91 per gallon, up less than a penny from last week, and the Gulf Coast price remains at $3.82 per gallon, down less than a penny from last week. Rounding out the regions, the Rocky Mountain price decreased one cent to $3.92 per gallon.
Propane inventories slightly higher
Total U.S. inventories of propane rose slightly from last week to remain at 61.9 million barrels, but are 9.1 million barrels (12.8 percent) lower than the same period a year ago. Midwest inventories gained by 0.1 million barrels, while Rocky Mountain/West Coast and East Coast inventories increased slightly. Gulf Coast inventories decreased by 0.1 million barrels. Propylene non-fuel-use inventories represented 4.7 percent of total propane inventories.
Text from the previous editions of This Week In Petroleum is accessible through a link at the top right-hand corner of this page.
 |
 |
||||||
| Retail Data | Change From Last | Retail Data | Change From Last | ||||
| 08/19/13 | Week | Year | 08/19/13 | Week | Year | ||
| Gasoline | 3.550 | Diesel Fuel | 3.900 | ||||
 |
 |
||||||||||||||||||||||||||
|
 |
||||||||||||||||||||||||||
| *Note: Crude Oil Price in Dollars per Barrel. | |||||||||||||||||||||||||||
 |
 |
||||||
 |
 |
||||||
| Stocks Data | Change From Last | Stocks Data | Change From Last | ||||
| 08/16/13 | Week | Year | 08/16/13 | Week | Year | ||
| Crude Oil | 359.1 | Distillate | 129.4 | ||||
| Gasoline | 218.4 | Propane | 61.892 | ||||