Released: April 24, 2013
Next Release: May 1, 2013
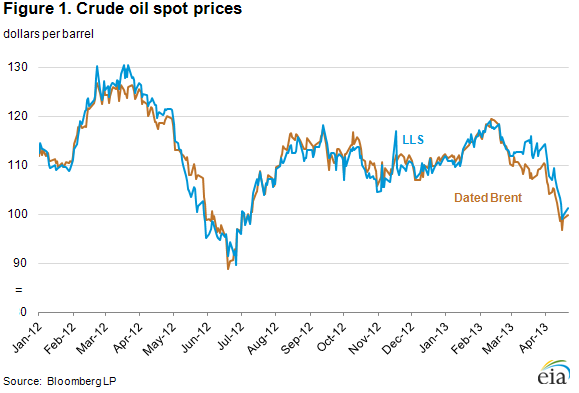
LLS-Brent differential has narrowed from its recent high
Since reaching a 2013 high of $119 per barrel in mid-February, the spot price of Brent crude oil, the global seaborne light sweet benchmark crude, fell by $19 per barrel, settling at $100 per barrel on April 22 (Figure 1). Concerns over global macroeconomic growth, a seasonal decline in European and Asian refinery runs, and an increase in North Sea production have been cited as fundamentals driving Brent prices lower. Over this same period, the price of Louisiana Light Sweet (LLS) crude on the U.S. Gulf Coast also declined for the same reasons. However, the price declined less as U.S. refiners on the Gulf Coast completed refinery maintenance and increased crude runs and as supplies of LLS were disrupted by pipeline problems. As a result, the differential between LLS and Brent topped $7/bbl, its widest level in recent years (Figure 2). More recently, as LLS supply disruptions eased, the LLS-Brent differential is returning to its recent parity.
Historically, LLS was priced above Brent to attract light sweet Brent price-based crudes, including those from Africa, to the United States. As recently as 2006, the United States processed nearly 900,000 barrels per day of imported light sweet crude in the U.S. Gulf Coast (PADD 3), creating an actively traded market for imported light sweet crude cargoes in the region. More recently, with the increase in U.S. production of light sweet crude oil, including Bakken and Eagle Ford, imports of light sweet crude processed in PADD 3 have declined significantly to less than 70,000 barrels per day in January 2013. As a result, there are now fewer cargoes available on short notice, so when LLS supplies were constrained in mid-March, there were no readily available replacement barrels and LLS prices increased.
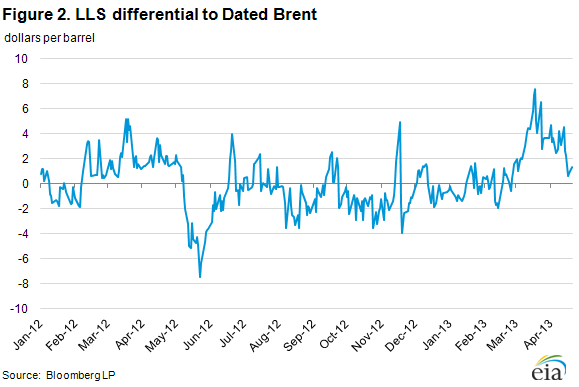
As refineries were increasing crude runs in March, an operating problem on the Eugene Island pipeline system (offshore Louisiana) that moves crude oil onshore from the Gulf of Mexico curtailed delivery of Eugene Island crude oil. Eugene Island crude oil is blended with other grades of crude to produce LLS-quality crude. In the absence of readily available replacement supply, as few if any uncommitted light sweet crude cargoes were available in the U.S. Gulf, LLS prices increased, pushing the LLS-Brent differential to its widest level in more than a year (Figure 2).
With the Eugene Island pipeline operating problems resolved, the price of LLS declined and the LLS premium over Brent returned to near typical levels of $2 per barrel. With an expected slight decline in North Sea crude loadings during May compared with levels reached in recent months and as U.S. Gulf Coast refinery runs likely level off, this relationship is expected to persist.
Looking further ahead, LLS may begin to sell at a persistent structural discount against Brent, as well as other comparable global seaborne crudes. The timing of this shift is dependent on the speed of the continuing ramp-up in domestic crude production and reduction of waterborne imports to the U.S. Gulf Coast. If Gulf Coast refiners reach the point where the availability of domestic light sweet crudes meets, or exceeds, their feedstock requirements, and light sweet grades are no longer imported by Gulf Coast refiners, the relative price for LLS and similar domestic crudes on the Gulf may be discounted relative to their global seaborne counterparts on a sustained basis.
Gasoline price down less than a penny, diesel fuel drops six cents
The U.S. average retail price of regular gasoline decreased less than one cent to remain at $3.54 per gallon as of April 22, 2013, down 33 cents from last year at this time. The U.S. average price has decreased 25 cents over the last eight weeks. Prices were lower in all regions of the nation except the Midwest, where the price increased nine cents to $3.55 per gallon. The East and West Coast prices both fell five cents, to $3.48 per gallon and $3.84 per gallon, respectively. The Gulf Coast price dropped four cents to $3.32 per gallon. Rounding out the regions, the Rocky Mountain price decreased two cents to $3.49 per gallon.
The national average diesel fuel price decreased six cents to $3.89 per gallon, 20 cents lower than last year at this time. The U.S. average diesel price has fallen 27 cents over the last eight weeks, and prices decreased in all regions of the nation for the second consecutive week. The largest decrease came on the West Coast, where the price decreased eight cents to $3.99 per gallon. The last time the West Coast price was under $4 per gallon was January 14, 2013. The Midwest price is $3.87 per gallon, down six cents from last week. The East and Gulf Coast prices both dropped a nickel, to $3.92 per gallon and $3.80 per gallon, respectively. The Rocky Mountain price is now $3.85 per gallon, falling four cents from last week.
Propane inventories decline
U.S. propane stocks fell 0.1 million barrels to end at 39.0 million barrels last week, and are 8.5 million barrels (17.9 percent) lower than the same period a year ago. Gulf Coast inventories dropped by 0.4 million barrels, while Rocky Mountain/West Coast stocks declined slightly. Midwest and East Coast inventories each increased by 0.2 million barrels. Propylene non-fuel-use inventories represented 9.6 percent of total propane inventories.
Text from the previous editions of This Week In Petroleum is accessible through a link at the top right-hand corner of this page.
 |
 |
||||||
| Retail Data | Change From Last | Retail Data | Change From Last | ||||
| 04/22/13 | Week | Year | 04/22/13 | Week | Year | ||
| Gasoline | 3.536 | Diesel Fuel | 3.887 | ||||
 |
 |
||||||||||||||||||||||||||
|
 |
||||||||||||||||||||||||||
| *Note: Crude Oil Price in Dollars per Barrel. | |||||||||||||||||||||||||||
 |
 |
||||||
 |
 |
||||||
| Stocks Data | Change From Last | Stocks Data | Change From Last | ||||
| 04/19/13 | Week | Year | 04/19/13 | Week | Year | ||
| Crude Oil | 388.6 | Distillate | 115.3 | ||||
| Gasoline | 217.8 | Propane | 38.964 | ||||