Released: March 6, 2013
Next Release: March 13, 2013
U.S. liquid fuels consumption fell in 2012, the 6th decline in the last seven years
In 2012, overall U.S. liquid fuels (a category dominated by petroleum products) product supplied (a proxy for consumption) was 2.1 percent, or 394,000 barrels per day (bbl/d), below its 2011 level. The 2012 decline in total liquid fuels consumption marks the second consecutive year in which consumption fell, and consumption has now declined in six of the last seven years dating back to 2006 (Figure 1). With declining domestic liquid fuels use, U.S. refiners, particularly on the Gulf Coast, have turned to export markets as an outlet for their production. The release of the U.S. Energy Information Administration's (EIA) February Petroleum Supply Monthly (PSM) provides the first look at monthly petroleum data for all of 2012.
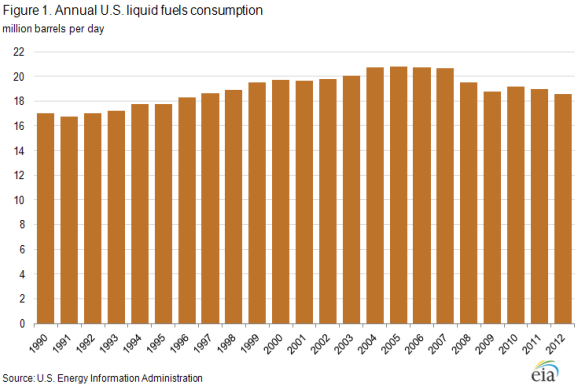
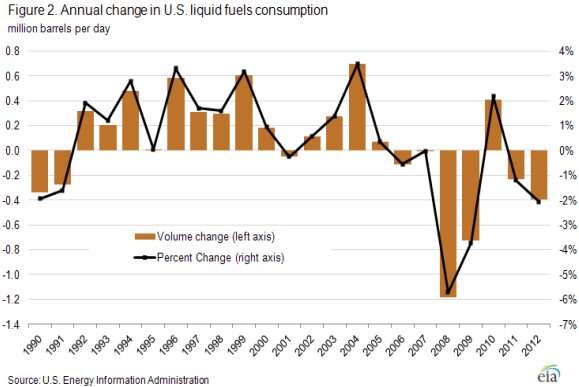
At 18.6 million bbl/d, U.S. liquid fuels consumption in 2012 was at its lowest level since 1996, 2.2 million bbl/d below the peak level of 20.8 million bbl/d reached in 2005. Factors contributing to the recent trend of declining use include higher petroleum prices, economic challenges, changing consumer preferences, and increases in fuel efficiency standards for vehicles. Higher petroleum prices have encouraged more efficient use of petroleum products as well as substitution of more economic fuels, such as natural gas, for petroleum-derived fuels for home heating and electricity generation. The economic downturn in 2008 and 2009 coincided with the sharpest decline in use, with total liquid fuels consumption falling a combined 1.9 million bbl/d in those two years. The only year since 2005 in which U.S. petroleum use increased was 2010, when the U.S. economy was recovering from its sharp downturn (Figure 2).
Turning to specific products, the largest volumetric decline in 2012 consumption was in distillate fuels, with a 156,000-bbl/d reduction from 2011. The February 27 edition of TWIP discussed this decline in detail, noting lower demand for heating oil, a decrease in rail traffic, and lower use in the electric power sector. On a percentage basis, the largest decline among product categories was a 25.2-percent (116,000-bbl/d) decline in residual fuel oil. Residual fuel oil consumption has been indecline for decades-28 out of the last 39 years-as natural gas has replaced residual fuel oil in the electric power sector and other industrial and commercial applications. Additionally, as more U.S. refiners add heavy upgrading capacity such ascokingmore residual fuel oil is used as a refinery feedstock rather than as a final consumer product.
In addition to the decline in residual and distillate fuels, use of gasoline, jet fuel, and other products declined by 50,000 bbl/d (0.6 percent), 25,000 bbl/d (1.8 percent), and 66,000 bbl/d, respectively. The only product category with increased use in 2012 was natural gas liquids and liquefied refinery gases, with a 20,000-bbl/d (0.9-percent) rise in consumption.
Despite declining consumption, production of refined products at U.S. refineries has remained relatively stable since 2005, decreasing by only 215,000 bbl/d (1.4 percent), significantly less than the decrease in consumption. Instead of reducing production as a result of lower demand, strong global demand for refined products has allowed U.S. refiners to sell product into the global market. Since 2005, global consumption of liquid fuels has increased 5.1 million bbl/d (6.0 percent). U.S. refiners have increased total product exports by 2.0 million bbl/d per day, from 1.1 million bbl/d in 2005 to 3.1 million bbl/d in 2012. Over the same period, imports of product fell 1.5 million bbl/d, from 3.6 million bbl/d to 2.1 million bbl/d, turning the United States into a net exporter of liquid fuels beginning in 2011.
Gasoline and diesel fuel prices both fall
The U.S. average retail price of regular gasoline decreased three cents to $3.76 per gallon, down three cents from last year at this time. The largest decrease came on the Gulf Coast, where the price decreased five cents to $3.58 per gallon. The East Coast price dropped four cents to $3.76 per gallon, and the Midwest price is $3.71 per gallon, down three cents from last week. Prices rose in the western regions, where the Rocky Mountains had the only price higher than a year ago at $3.48 per gallon, up a cent, and the West Coast price is up two cents to $4.07 per gallon.
The national average diesel fuel price decreased three cents to $4.13 per gallon, four cents higher than last year at this time. Prices decreased in all regions of the nation, with the largest decrease coming in the Midwest, where the price fell four cents to $4.09 per gallon. The East Coast price is $4.17 per gallon, a decrease of three cents. Both the Gulf Coast and West Coast prices declined two cents, to $4.07 per gallon and $4.28 per gallon, respectively. Rounding out the regions, the Rocky Mountain price decreased a penny to $4.05 per gallon.
Propane inventories decline
U.S. propane stocks fell 2.2 million barrels to end at 45.7 million barrels last week, yet are 2.2 million barrels (5.0 percent) higher than the same period a year ago. Midwest inventories dropped by 1.7 million barrels, and Gulf Coast regional inventories declined by 0.4 million barrels. East Coast stocks dropped by 0.1 million barrels, and stocks in the Rocky Mountain/West Coast region also declined by 0.1 million barrels. Propylene non-fuel-use inventories represented 6.5 percent of total propane inventories.
Residential heating fuel prices decreased
Residential heating oil prices decreased during the period ending March 4, 2013. The average residential heating oil price decreased by 7 cents to $4.06 per gallon, 4 cents per gallon lower than the same time last year. Wholesale heating oil prices decreased by 18 cents to nearly $3.10 per gallon, 22 cents per gallon less than last year at this time.
The average residential propane price fell by less than a penny, holding at $2.49 per gallon for the third consecutive week, almost 38 cents per gallon lower than the same period last year. Wholesale propane prices decreased by nearly 2 cents to $0.97 per gallon for the week ending March 4, 2013, 26 cents per gallon lower than the March 5, 2012 price.
Text from the previous editions of This Week In Petroleum is accessible through a link at the top right-hand corner of this page.
 |
 |
||||||
 |
 |
||||||
| Retail Data | Change From Last | Retail Data | Change From Last | ||||
| 03/04/13 | Week | Year | 03/04/13 | Week | Year | ||
| Gasoline | 3.759 | Heating Oil | 4.058 | ||||
| Diesel Fuel | 4.130 | Propane | 2.492 | ||||
 |
 |
||||||||||||||||||||||||||
|
 |
||||||||||||||||||||||||||
| *Note: Crude Oil Price in Dollars per Barrel. | |||||||||||||||||||||||||||
 |
 |
||||||
 |
 |
||||||
| Stocks Data | Change From Last | Stocks Data | Change From Last | ||||
| 03/01/13 | Week | Year | 03/01/13 | Week | Year | ||
| Crude Oil | 381.4 | Distillate | 120.4 | ||||
| Gasoline | 227.9 | Propane | 45.672 | ||||