Trading volumes for Brent futures surpass WTI in 2012
One of the many effects of the well-documented disconnect between the prices of Brent and West Texas Intermediate (WTI) crude oils has been the increase in trading volume for Brent futures. In 2012, for the first time, more Brent futures contracts traded on the IntercontinentalExchange for the year as a whole than WTI futures contracts traded on the New York Mercantile Exchange (Figure 1). This increase in Brent futures trading volume is prompting other changes in the financial markets, including a reweighting of commodity index funds away from WTI futures and toward Brent futures. The volume of options written on prompt Brent futures is also rising.
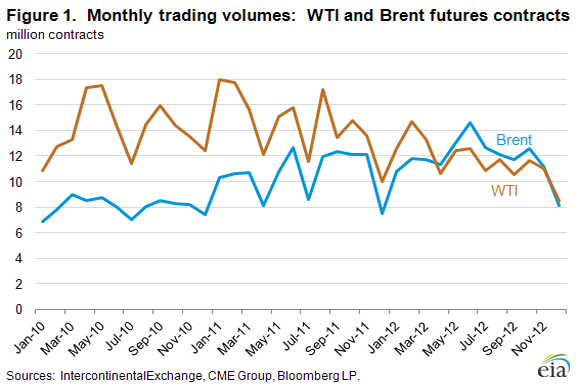
Two years ago, the difference in the volumes traded of Brent and WTI futures contracts began to narrow as growing supply combined with transportation infrastructure constraints to disconnect WTI from the global seaborne crude oil market and, as a result, WTI prices no longer reflected global crude oil price levels. In April 2012 the volume of Brent crude oil futures traded exceeded that of WTI futures for the first time. Prior to December, Brent trading volumes had been higher than WTI volumes for eight consecutive months. In December, Brent volumes dipped lower than WTI volumes, but December typically sees light trading volumes and is not necessarily indicative of a trend.
Trading volume is one of the major determinants of how a specific commodity is weighted in the indexes that are used by many investors to include commodities in their investment portfolios. Index fund managers tend to shift investments to commodities with higher trading volumes. The S&P Goldman Sachs Commodity Index (GSCI) has increased its target weighting of Brent from 15.9 percent in 2011 to 22.3 percent in 2013, while dropping WTI from 32.6 to 24.7 percent. Similarly, the Dow Jones-UBS Commodity Index (DJUBS), which included Brent for the first time in 2012 with a 5.3-percent weighting, has increased the 2013 target weight to 5.8 percent. Note that the crude oil weightings in the DJUBS are less than the GSCI because the DJUBS restricts the total exposure to any one sector, such as energy, to 33.3 percent of the total index.
Another reason index funds have become more interested in Brent is the difference in roll yields, which reflect the value (either positive or negative) of maintaining the portfolio positions from one month to the next as expiring contracts are sold and replaced with active contracts. Crude oil futures are dated and require delivery in a specific month. To maintain their positions, index funds must sell the front month contract and buy the second month contract before the front month contract expires. A commodity in backwardation (when the second month price is less than the front month price) lets the index fund realize a small gain when it purchases the second month futures contract for less than the price at which it sells the front month contract. The opposite is true when the commodity is in contango (when the second month price is higher than the front month price) and the fund loses a small percentage. Since the spring of 2012, the WTI futures market has been consistently in contango and the Brent futures market has almost always been backwardated. As a result, WTI has consistently had a negative roll yield while Brent, with the exception of two weeks in June 2012, has had a positive roll yield ranging as high as 1.5 percent.
The increase in Brent futures trading volume has also helped spur a volume increase in options traded on Brent futures contracts. In November 2011, an average of 11,800 Brent options were traded each day; in November 2012, about 40,100 were traded daily. Despite this growth in Brent options activity, the WTI options market is still considerably larger and more liquid, with 127,300 options traded on an average day in November 2012. Moreover, as most of the increase in Brent options trading has been concentrated in the prompt month, WTI remains the only crude oil with significant trading volumes in longer-dated options.
Gasoline price up while diesel fuel price drops slightly to end the year
The U.S. average retail price of regular gasoline increased four cents to $3.30 per gallon, down a tenth of a penny from last year at this time. Prices increased in all regions of the nation except the Rocky Mountains, where the price decreased eight cents to $3.02 per gallon. The East Coast, Gulf Coast, and Midwest prices all increased a nickel, to $3.40 per gallon, $3.11 per gallon, and $3.22 per gallon, respectively. Rounding out the regions, the West Coast price increased three cents to $3.46 per gallon.
The national average diesel fuel price decreased less than a penny to remain at $3.92 per gallon, 14 cents higher than last year at this time. The U.S. average diesel price has decreased 12 cents in the last five weeks. The price on the East Coast was unchanged from last week at $4.01 per gallon. On the West Coast, diesel fuel remained at $3.99 per gallon, up less than a penny from last week. The Rocky Mountain price dropped a nickel to $3.75 per gallon, while the Midwest and Gulf Coast prices decreased less than a penny to remain at $3.89 per gallon and $3.83 per gallon, respectively.
Propane inventories
U.S. propane stocks fell 2.2 million barrels to end at 66.7 million barrels last week, 11.5 million barrels (21 percent) higher than a year ago. Gulf Coast regional inventories dropped by 1.5 million barrels, while Midwest inventories declined by 0.6 million barrels. Rocky Mountain/West Coast stocks dropped by 0.1 million barrels, and the East Coast region gained about 0.1 million barrels. Propylene non-fuel-use inventories represented 5.6 percent of total propane inventories.
Residential heating oil and propane prices increase
Residential heating oil prices increased during the period ending December 31, 2012. The average residential heating oil price increased by a penny to $3.96 per gallon, nearly 12 cents per gallon higher than the same time last year. Wholesale heating oil prices increased by 2 cents per gallon last week to nearly $3.17 per gallon, almost 17 cents per gallon more than last year at this time.
The average residential propane price rose by 2 cents to $2.43 per gallon, 43 cents per gallon lower than the same period last year. Wholesale propane prices increased by 7 cents to almost $0.98 per gallon for the week ending December 31, 2012, 36 cents per gallon lower than the January 2, 2012 price.
Text from the previous editions of This Week In Petroleum is accessible through a link at the top right-hand corner of this page.
 |
 |
||||||
 |
 |
||||||
| Retail Data | Change From Last | Retail Data | Change From Last | ||||
| 12/31/12 | Week | Year | 12/31/12 | Week | Year | ||
| Gasoline | 3.298 | Heating Oil | 3.961 | ||||
| Diesel Fuel | 3.918 | Propane | 2.431 | ||||
 |
 |
||||||||||||||||||||||||||
|
 |
||||||||||||||||||||||||||
| *Note: Crude Oil Price in Dollars per Barrel. | |||||||||||||||||||||||||||
 |
 |
||||||
 |
 |
||||||
| Stocks Data | Change From Last | Stocks Data | Change From Last | ||||
| 12/28/12 | Week | Year | 12/28/12 | Week | Year | ||
| Crude Oil | 359.9 | Distillate | 124.0 | ||||
| Gasoline | 225.7 | Propane | 66.670 | ||||