Released: December 5, 2012
Next Release: December 12, 2012
New EIA assessment shows faster rise in U.S. oil production and less U.S. oil consumption
The U.S. Energy Information Administration (EIA) today issued the Reference case of its Annual Energy Outlook 2013 (AEO2013) showing an increase from last year's AEO in projected domestic crude oil production, particularly from shale and other tight oil formations. Petroleum fuels continue to dominate transportation sector consumption in AEO2013. However, gasoline consumption is expected to decline both in absolute terms and as a share of total transportation fuel demand, due to the introduction of more stringent corporate average fuel economy standards as well as demographic and economic changes. Petroleum-based diesel fuel is projected to account for a growing share of petroleum-based transportation fuel demand, but growth in its use is moderated by increased use of liquefied natural gas (LNG) or compressed natural gas (CNG) and gas-to-liquids (GTL) fuels in heavy-duty vehicles.
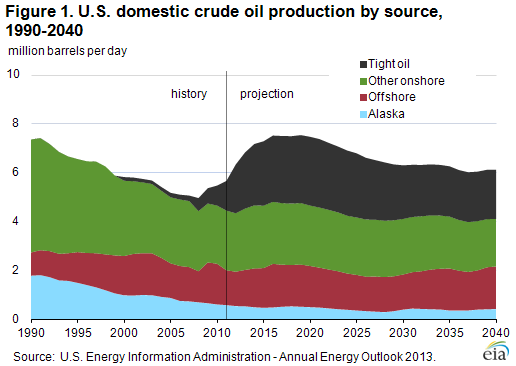
Crude oil production, particularly from tight oil plays, continues to rise sharply in the AEO2013 projection through 2019, when production reaches 7.5 million barrels per day (bbl/d) (Figure 1). Growth is driven largely by a significant increase in onshore production, particularly from shale and other tight formations. After 2019, production declines gradually, falling to 6.1 million bbl/d in 2040. This decline reflects a decrease in tight oil production as producers move from sweet spots to less-productive or less-profitable areas. Production of natural gas liquids also grows significantly over the coming decade.
Overall, light-duty vehicle liquid fuel consumption, the main component of which is gasoline, is lower in AEO2013 than in AEO2012 primarily due to the recently enacted fuel economy and greenhouse gas emission standards. Projected gasoline consumption in the transportation sector is reduced by 0.5 million bbl/d in 2025 and by 1.0 million bbl/d in 2035 in AEO2013 compared to the AEO2012 Reference case (Figure 2).
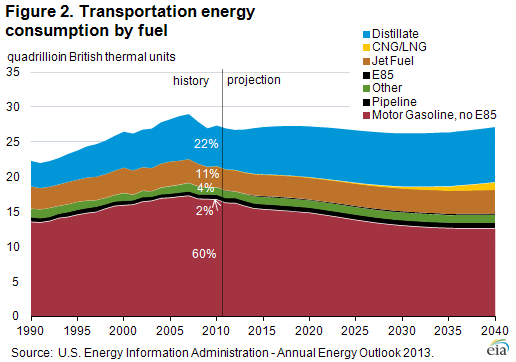
Distillate fuel consumption in the AEO2013 projection increases slightly over the forecast period and as compared to AEO2012, adding to pressure on refiners to increase distillate yields. The growth in distillate fuel consumption is moderated by increased use of natural gas in heavy-duty vehicles. Improved economics of LNG for heavy-duty vehicles offsets a portion of distillate fuel consumption, as does distillate production from GTL technology. Natural gas use in vehicles reaches 1.7 trillion cubic feet (including GTL) by 2040, displacing 0.7 million bbl/d of other motor fuels.
Gasoline and diesel fuel prices both decrease
The U.S. average retail price of regular gasoline decreased four cents to $3.39 per gallon, 10 cents higher than last year at this time. Prices decreased in all regions of the nation. The Midwest and Rocky Mountain prices are both down seven cents, to $3.32 per gallon and $3.41 per gallon, respectively. Declining a nickel, the West Coast price is $3.62 per gallon, and the East Coast price is $3.46 per gallon, three cents lower than last week.
The national average diesel fuel price decreased a penny to $4.03 per gallon, 10 cents higher than last year at this time. Prices decreased in all regions of the nation except the East Coast, where the price increased a fraction of a cent to $4.10 per gallon. The largest decrease came in the Rocky Mountain region, where the price declined seven cents to $3.99 per gallon. On the West Coast, the price is $4.10 per gallon, a decrease of two cents from last week. The Midwest price is down a penny to $4.01 per gallon, and the Gulf Coast price decreased less than a penny to remain at $3.90 per gallon.
Propane inventories decline
U.S. propane stocks fell 0.3 million barrels to end at 72.5 million barrels last week, 12.8 million barrels (22 percent) higher than a year ago. Gulf Coast regional inventories dropped by 0.2 million barrels, while Midwest and East Coast inventories both declined by 0.1 million barrels. Rocky Mountain/West Coast stocks gained slightly. Propylene non-fuel-use inventories represented 5.6 percent of total propane inventories.
Residential heating fuel prices show little change
Residential heating oil prices held steady during the period ending December 3, 2012. The average residential heating oil price fell a fraction of a cent to $4.00 per gallon, nearly 11 cents per gallon higher than the same time last year. Wholesale heating oil prices decreased by 3 cents per gallon last week to $3.22 per gallon, almost 15 cents per gallon more than last year at this time.
The average residential propane price increased by less than a penny last week to slightly more than $2.41 per gallon, 43 cents per gallon lower than the same period last year. Wholesale propane prices decreased by a penny to $0.91 per gallon for the week ending December 3, 2012, 54 cents per gallon lower than the December 5, 2011 price.
Text from the previous editions of This Week In Petroleum is accessible through a link at the top right-hand corner of this page.
 |
 |
||||||
 |
 |
||||||
| Retail Data | Change From Last | Retail Data | Change From Last | ||||
| 12/03/12 | Week | Year | 12/03/12 | Week | Year | ||
| Gasoline | 3.394 | Heating Oil | 4.002 | ||||
| Diesel Fuel | 4.027 | Propane | 2.413 | ||||
 |
 |
||||||||||||||||||||||||||
|
 |
||||||||||||||||||||||||||
| *Note: Crude Oil Price in Dollars per Barrel. | |||||||||||||||||||||||||||
 |
 |
||||||
 |
 |
||||||
| Stocks Data | Change From Last | Stocks Data | Change From Last | ||||
| 11/30/12 | Week | Year | 11/30/12 | Week | Year | ||
| Crude Oil | 371.8 | Distillate | 115.1 | ||||
| Gasoline | 212.1 | Propane | 72.510 | ||||