Released on April 16, 2008
(Next Release on April 23, 2008)
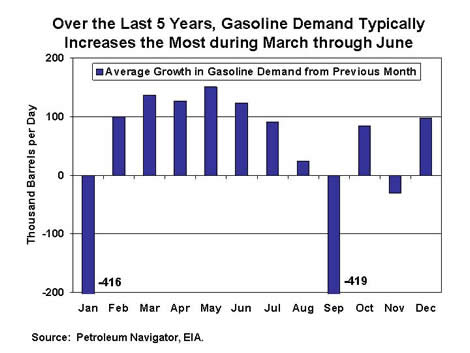
Time of the Year
If winter is the “Most Wonderful Time of the Year” as the popular song implies, it may not be too much of a surprise that gasoline consumers find the spring and summer anything but wonderful, when it comes to prices. This year’s upcoming spring and summer are expected to see retail gasoline prices rise even further from current high levels.
Since last fall, the average U.S. retail price for regular gasoline has been close to or above $3 per gallon in large part due to high crude oil prices. High crude oil prices are expected to remain an important reason why retail gasoline prices are projected to stay above $3 per gallon for some time to come. As the chart below indicates, we are now in the “time of the season” when gasoline demand begins to increase. As seasonal demand increases, prices tend to rise as well, all else equal. Even though U.S. gasoline demand has been lower than year-ago levels so far this year, EIA still expects that rising gasoline demand over the next few months will drive retail prices higher. So, while gasoline prices have risen above $3 per gallon mostly due to high crude oil prices, increasing gasoline demand will likely take retail gasoline prices to $3.50 per gallon and above, even if year-over-year gasoline demand is negative. The simple fact that more and more gasoline will be used over the next few months will probably be enough to cause retail gasoline prices to increase, even if crude oil prices begin declining, as EIA is currently projecting. Additionally, the cost of making “summer-grade” gasoline (“summer-grade” gasoline produces less smog) is significantly more than making “winter-grade” gasoline, helping to raise retail prices even further during the summer months, all else equal.
Of course, should crude oil prices not decline from current levels of over $110 per barrel for West Texas Intermediate (WTI) crude oil, retail gasoline prices could end up peaking even higher than EIA is currently projecting. In our latest Short-Term Energy Outlook, we project the U.S. average retail price for regular gasoline to average around $3.60 per gallon in May and June, implying prices even higher than that during some parts of those months. This projection is based on average monthly WTI spot prices of about $103-$104 per barrel and retail margins (the difference between retail prices and average crude oil prices) high, but still much lower than last year. Last year, the average WTI spot price was around $65 during May and June, nearly $40 less than what is projected for this year. However, the retail margin last year averaged $1.55 per gallon over those 2 months last year, while this year it is expected to only average about $1.15 per gallon. If retail margins this year end up being closer to last year’s and/or crude oil prices higher than currently projected (and the WTI spot price as of yesterday was about $10 higher than our current projection for May and June), U.S. gasoline consumers may end up wishing winter was just around the corner.
U.S. Gasoline Prices Highest Ever in All Regions; U.S. Average Diesel Price Surpasses $4 a Gallon for the First Time
For the third consecutive week, the U.S. average retail price for regular gasoline moved higher, setting another all-time record of 338.9 cents per gallon. The price gained 5.7 cents from last week and rose 51.3 cents higher than a year ago. On a regional basis, prices not only increased throughout the country but also reached new all-time highs in every region. The average price on the East Coast went up by 5.1 cents to 333.5 cents per gallon, 49.6 cents higher than last year. The price in the Midwest increased by 5.9 cents to 335.8 cents per gallon, up by 55.1 cents from a year earlier. The average price in the Gulf Coast of 328.5 cents per gallon was the lowest of any region and the increase there of 3.2 cents was the smallest increase for any region. The average price in the Rocky Mountains increased to 332.4 cents per gallon, up 5.7 cents from the previous week. The West Coast price increased by the largest amount for any region, moving up by 8.4 cents to 366.2 cents per gallon, 46.7 cents higher than a year ago. The average price in California increased even more, shooting up by 8.9 cents to reach 377.4 cents per gallon.
Unlike the previous two weeks when the U.S. average diesel price and prices in most regions went down, the U.S. average price and prices in all regions of the country increased. The U.S. average price surged, moving up by 10.4 cents to 405.9 cents per gallon, surpassing $4 per gallon for the first time in history and up by 118.2 cents over the price last year. Prices increased sharply in all regions of the country. The average price for the East Coast jumped up by 11.2 cents to 411.7 cents per gallon. In the Midwest, the price increased by 9.6 cents to 401.3 cents per gallon. The price in the Gulf Coast shot up by 10.6 cents to reach $4 even, the lowest price of any region. The increase in the Rocky Mountain region of 6.5 cents was the smallest increase of any region. The price there of 403.9 cents per gallon was 105.8 cents higher than a year earlier. On the West Coast, the average price surged, moving up by 12.4 cents to 417.6 cents per gallon, 122.0 cents above the price last year. The average price in California shot up by 11.6 cents, to 423.4 cents per gallon.
Propane Inventories Post Small Gain
Primary inventories of propane posted a small 0.2 million-barrel gain last week, reaching an estimated 25.4 million barrels as of April 11, 2008. The combination of lower production and imports, compared with the prior week, contributed to moderate last week’s stock build. Regional inventories showed mixed activity last week, with gains on the East Coast of 0.1 million barrels, in the Midwest of 0.2 million barrels, and the combined Rocky Mountain region, with 0.1 million barrels. During this same period, Gulf Coast inventories showed a similar loss of 0.2 million barrels. Propylene non-fuel use inventories gained 0.1 million barrels and accounted for a higher 8.1 percent of total propane/propylene inventories, up from 7.9 percent reported during the prior week.
Text from the previous editions of “This Week In Petroleum” is now accessible through a link at the top right-hand corner of this page.
| Retail Prices (Cents Per Gallon) | |||||||
 |
 |
||||||
| Retail Data | Changes From | Retail Data | Changes From | ||||
| 04/14/08 | Week | Year | 04/14/08 | Week | Year | ||
| Gasoline | 338.9 | Diesel Fuel | 405.9 | ||||
| Spot Prices (Cents Per Gallon) | |||||||||||||||||||||||||||||||||||||||
 |
 |
||||||||||||||||||||||||||||||||||||||
 |
 |
||||||||||||||||||||||||||||||||||||||
|
 |
||||||||||||||||||||||||||||||||||||||
| Stocks (Million Barrels) | |||||||
 |
 |
||||||
 |
 |
||||||
| Stocks Data | Changes From | Stocks Data | Changes From | ||||
| 04/11/08 | Week | Year | 04/11/08 | Week | Year | ||
| Crude Oil | 313.7 | Distillate | 106.1 | ||||
| Gasoline | 215.8 | Propane | 25.416 | ||||