Released: December 7, 2011
Next Release: December 14, 2011
The Return of Libya
The pace of Libya's reentry into world oil markets has exceeded our prior expectations and those of many other outside observers. While opinions vary significantly on the eventual trajectory for Libyan oil production, nearly all forecasts have steadily shifted upwards as the country's oil sector and related institutions continue to progress.
Libya's National Oil Corporation (NOC) claims to be on track to meet its goal of returning to pre-war crude oil production levels of 1.65 million barrels per day (bbl/d) by the end of 2012. Most analysts now expect production to reach anywhere between 1.0 and 1.6 million bbl/d during that timeframe. Based in part on developments in recent weeks (Table 1), the U.S. Energy Information Administration (EIA) expects that Libyan output may ramp up to 1 million bbl/d by the beginning of the second quarter of 2012. Thereafter, EIA expects crude oil production to plateau somewhat, increasing only gradually to about 1.2 million bbl/d by the end of 2012, along an uneven and non-linear path.
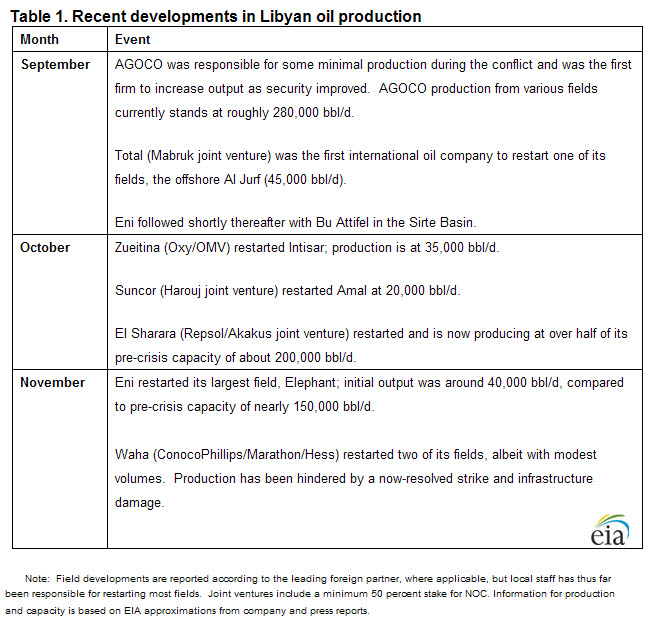
Libyan oil exports suffered a near-total disruption earlier this year during months of intense fighting between Colonel Muammar Gaddafi's regime and the opposition, as sporadic production fell to minimal levels and was mostly consumed domestically. As the Transitional National Council (TNC) and affiliated rebel militias consolidated control over most of the country in recent months, however, initial volumes from the fields operated by international oil companies (IOCs) through joint ventures with NOC began to supplement increased production from NOC subsidiaries, including the Arabian Gulf Oil Company (AGOCO).
Libya's complex array of concession areas, production sharing arrangements, crude grades, and export infrastructure complicates efforts to track production claims. But field-level reporting suggests that crude oil production rose to at least 600,000 bbl/d by the end of November, over one third of pre-crisis levels, from about 350,000 bbl/d in October. According to the tanker shipments tracked in the Lloyd's List Intelligence APEX database, Libyan crude oil exports averaged 160,000 bbl/d in October and over 400,000 bbl/d in November.
An earlier edition of This Week in Petroleum outlined some of the key infrastructural, political, and security factors affecting the outlook for Libyan oil production. In terms of infrastructure, it appears that most upstream assets fared better during the fighting than initial reports had suggested. A comprehensive assessment of the country's infrastructure, however, awaits more thorough inspections of the various producing regions within Libya. Moreover, returning a field to full capacity may be far more challenging than simply restarting it, particularly in the case of older infrastructure and more depleted fields that were hastily shut down. Downstream, most refineries are fully operational; the largest, Ras Lanuf, is reportedly prepared to restart. The most significant conflict-related damage was to crude export terminals, especially Es Sider (As Sidrah), which could take up to a year to be restored fully.
Political considerations and related security concerns are among the most critical factors in Libya's post-disruption oil production trajectory, and are inherently uncertain. Recently, a stream of encouraging developments has increased confidence in the TNC's ability to manage the oil sector's continued recovery and the country's political transition. But the country's security situation remains fragile, and its economy distressed. Underlying tensions, or, at worst, actual challenges to the distribution of power and resources in the emerging political order, could conceivably derail further gains in oil output or, at least, partially undermine what has already been achieved.
Local staff is largely responsible for Libya's progress to date. A return to full capacity and future growth in the country's oil sector, however, will require renewed participation of IOC capital and expertise. The rate at which foreign IOC employees return to Libya will likely depend on the pace of improvement in security conditions. The status of oil-sector contracts may also influence foreign involvement; TNC officials have stated repeatedly that they will honor all existing contracts, while also pledging to investigate those secured through corruption. Foreign involvement in the sector, including financial arrangements and investment decisions going forward, will be further affected by the evolving relationship between the oil ministry, the NOC, and its subsidiaries.
The extent to which the other members of the Organization of the Petroleum Exporting Countries (OPEC) adjust output as Libya comes back online will have important implications for global oil supply and spare capacity. For this reason among others, the oil markets will be watching closely for signals as OPEC prepares to meet on December 14. Just as the Libyan conflict impacted oil markets, so too can the return of Libyan production.
Retail gasoline and diesel prices fall
The U.S. average retail price of regular gasoline fell for the third week in a row losing almost two cents to reach $3.29 per gallon. The average price is $0.33 per gallon higher than last year at this time. Midwest prices rose just over two cents per gallon to reach $3.21 per gallon, the only region to see a price increase. The West Coast, where prices are highest among all the regions, saw the largest decrease of almost six cents per gallon to $3.59 per gallon. The Rocky Mountain region saw a decrease of almost five cents per gallon. Gulf Coast prices remained the lowest in the Nation at $3.09 per gallon, while prices on the East Coast fell almost three cents to $3.30 per gallon.
The national average diesel price fell for the second week consecutive week, losing just over three cents to hit $3.93 per gallon. The diesel price is $0.73 per gallon higher than last year at this time. Diesel prices were down across all the regions, with the biggest decrease coming in the Rocky Mountain region, where the price was almost six cents below last week's average. The West Coast lost almost four cents to put prices at $4.11 per gallon. Gulf Coast prices fell by three cents per gallon to $3.83 per gallon, the lowest regional price in the country. East Coast prices fell almost two cents per gallon, while prices in the Midwest dropped just over four cents per gallon to $3.91 per gallon.
U.S. residential heating oil price shows little change
Residential heating oil prices showed mixed regional results during the period ending December 5, 2011. The U.S. residential heating oil price remained relatively flat this week, averaging $3.89 per gallon, an increase of $0.69 per gallon from the same time last year. Prices showed minimal movement in all regions except the Midwest, where prices decreased on average by $0.06 per gallon. The wholesale heating oil price increased by $0.01 per gallon to reach $3.08 per gallon, $0.53 per gallon more than last year at this time.
The average residential propane price increased by less than 1 cent per gallon to stay at $2.85 per gallon, which is $0.25 per gallon higher than last year. The wholesale propane price moved slightly higher to $1.45 per gallon. This was an increase of $0.14 per gallon when compared with the December 6, 2010 price of $1.32 per gallon.
Propane stocks remain below average for this time of year
Total U.S. inventories of propane ended at 59.7 million barrels last week, down slightly from the previous week. The Gulf Coast was the only region where stock levels increased, adding 0.3 million barrels to end at 26.1 million barrels. East Coast stocks fell by 0.1 million barrels, while Midwest stocks dropped 0.2 million barrels. The Rocky Mountain/West Coast regional stocks also dropped by almost 0.1 million barrels. Propylene non-fuel use inventories represented 7.8 percent of total propane inventories.
Text from the previous editions of This Week In Petroleum is accessible through a link at the top right-hand corner of this page.
 |
 |
||||||
 |
 |
||||||
| Retail Data | Changes From | Retail Data | Changes From | ||||
| 12/05/11 | Week | Year | 12/05/11 | Week | Year | ||
| Gasoline | 3.290 | Heating Oil | 3.894 | ||||
| Diesel Fuel | 3.931 | Propane | 2.852 | ||||
 |
 |
||||||||||||||||||||||||||
|
 |
||||||||||||||||||||||||||
| *Note: Crude Oil Price in Dollars per Barrel. | |||||||||||||||||||||||||||
 |
 |
||||||
 |
 |
||||||
| Stocks Data | Changes From | Stocks Data | Changes From | ||||
| 12/02/11 | Week | Year | 12/02/11 | Week | Year | ||
| Crude Oil | 336.1 | Distillate | 141.0 | ||||
| Gasoline | 215.0 | Propane | 59.678 | ||||