Released: August 3, 2011
Next Release: August 10, 2011
Shifting Crude Oil Movements in the Mid-Continent
The price discount of inland benchmark West Texas Intermediate (WTI) crude oil relative to coastal and global waterborne crudes such as Louisiana Light Sweet and North Sea Brent has recently reached unprecedented levels. The widening WTI discount has already caused the market to begin self-correcting at the margin, resulting in some significant shifts in past patterns of crude oil and refined product movements within the United States.
Historically, the concentration of U.S. refining capacity in Petroleum Administration for Defense District 3 (PADD 3), i.e. the U.S. Gulf Coast, has made that region a net shipper of product to most other parts of the country, especially to the East Coast (PADD 1) and Midwest (PADD 2). As a major crude producing and importing region with deepwater ports, PADD 3 has also long served as a transit corridor for sending coastal-domestic and waterborne-imported crude oils to refining centers in the Midwest.
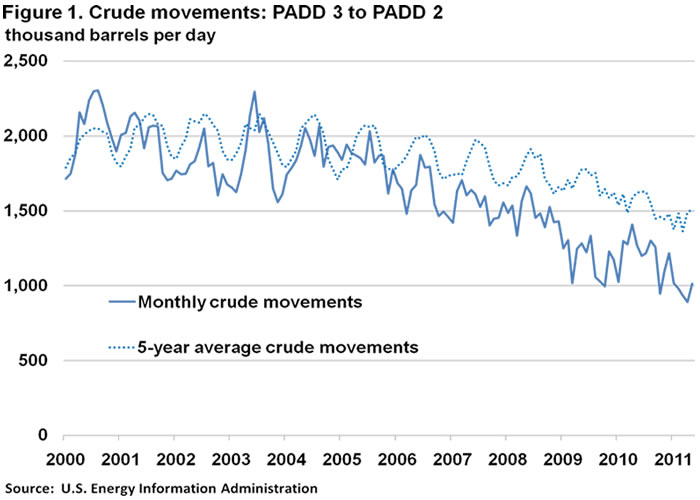
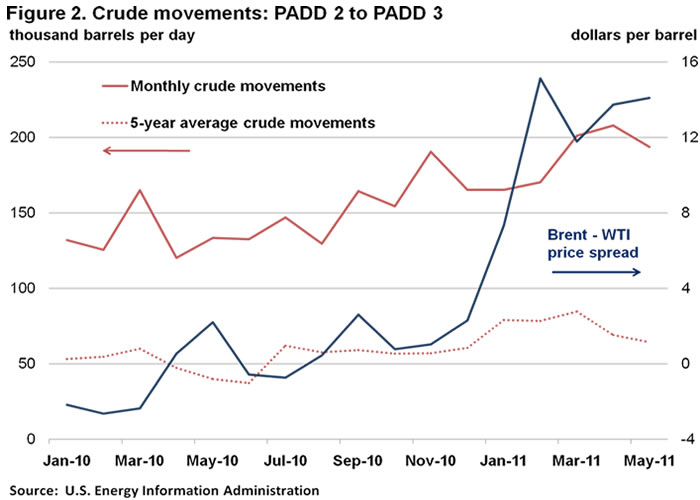
Crude oil movements from PADD 3 to PADD 2 have been declining over the past five years (Figure 1). An increasing supply of crude from Canada, and, more recently, the Bakken formation, into the Midwest has been one factor driving this trend. Decreased crude flows from the Gulf Coast to the Midwest have also been accompanied by growing crude flows from the Midwest to the Gulf Coast (Figure 2). The reversal in 2006 of a proprietary crude pipeline between Illinois and Texas made it possible to move some crude from the Midwest to the Gulf Coast by pipeline. Additional volumes have been increasingly moving by rail, barge, and even truck from the congested Midwest to Gulf Coast refining centers.
Petroleum Supply Monthly (PSM) data for May 2011, the most recent available, show pipeline shipments of crude oil from PADD 2 to PADD 3 at 166,000 barrels per day (bbl/d) and those by tanker and barge at 28,000 bbl/d; these are 43,000 bbl/d and 19,000 bbl/d increases, respectively, from January 2010. The latest edition of Petroleum Supply Annual (PSA), released July 28, 2011, includes significant upward revisions from preliminary monthly data of PADD 2 to PADD 3 crude shipments for 2010. However, EIA surveys exclude truck and rail shipments, which some third party sources estimate may be as large, or even larger, than the most recent pipeline shipment estimates. Thus, crude shipments from PADD 2 to PADD 3 are likely substantially higher than the EIA data indicate.
More pipeline projects to alleviate PADD 2 congestion and bring inland crude to coastal markets are under discussion, including the proposed Keystone XL project, currently under U.S. regulatory review. New pipeline capacity would help realign WTI prices with the broader market and would remain economical even at substantially lower Brent-WTI differentials. Which pipelines ultimately get built depends not just on price and cost considerations, but also permitting decisions by various governments. With the Brent-WTI spread above $15 per barrel (Figure 2), shipping economics provide a strong incentive for increasing petroleum movements out of PADD 2, even using high-cost modes of transportation such as rail and trucks. Barge, rail, and truck transport from PADD 2 to PADD 3 would likely continue to increase in the absence of new pipelines.
Finally, the substantial price discount of inland crudes is also having an impact on inter-PADD product movements, as relatively low crude prices in the Midwest have increased refining profitability in that region and prompted PADD 2 refiners to increase crude runs. Higher PADD 2 refinery product output has reduced inbound petroleum product shipments from the Gulf Coast while raising outbound flows. This has caused PADD 3 to ship more products to fast-growing Mexican and other Latin American export markets, instead of PADD 2.
Gasoline prices move higher while diesel prices fall
The U.S. average retail price of regular gasoline advanced for the fifth consecutive week, adding more than a penny to reach $3.71 per gallon. The average price is $0.98 per gallon higher than last year at this time. The largest increase came in the Midwest where the price was up more than two cents on the week. Following closely, the Rocky Mountains had a gain of an even two cents, but remained the least expensive in the country at $3.55 per gallon. The average price on the East Coast added more than a penny from last week, while the Gulf Coast average was almost flat. Moving in the other direction, the West Coast price fell slightly, but remained the highest in the country with an average of more than $3.75 per gallon.
The national average diesel price decreased for the first time in a month, falling more than a penny to $3.94 per gallon. The diesel price is $1.01 per gallon higher than last year at this time. Leading the declines, the West Coast registered close to a four-cent drop on the week. The East Coast average diesel price lost more than one cent against last week, while the Midwest and Gulf Coast both shed almost a penny off of the regional average prices. The Rocky Mountains bucked the trend, with diesel adding almost a penny to last week's average price.
Propane stocks post another seasonal build
U.S. propane stocks rose again last week, adding 1.1 million barrels to end at 49.4 million barrels in total. The largest stock build occurred in the Midwest region, where inventories increased by 0.6 million barrels. The Gulf Coast region added 0.4 million barrels, while the East Coast and Rocky Mountain/West Coast regional stocks each grew by less than 0.1 million barrels. Propylene non-fuel use inventories represented 4.9 percent of total propane inventories.
Text from the previous editions of This Week In Petroleum is accessible through a link at the top right-hand corner of this page.