Released: July 7, 2011
Next Release: July 13, 2011
Cushing inventories: taking a deeper look
Few oil market statistics are more closely watched by analysts and market participants than weekly crude oil inventories at Cushing, Oklahoma, the delivery point for the NYMEX West Texas Intermediate (WTI) light sweet crude oil futures contract. However, the market significance of inventory levels depends, in part, on total storage capacity, which varies over time. In December 2010, the U.S. Energy Information Administration's (EIA) first petroleum and other liquids storage capacity report added new information on working and net available shell storage capacity (as of September 30, 2010) to complement its weekly and monthly inventory data.
EIA's recently released second report on storage capacity not only updates those data through March 31, 2011, but also breaks out tank farm inventories from pipeline fill for crude oil at Cushing. The breakout is of particular interest, as analysts can now directly compare tank farm storage capacity to inventory levels, yielding a measure of storage capacity utilization.
As of March 31, working storage capacity at tank farms in the Cushing area stood at 48.0 million barrels, an increase of 2.1 million barrels (4.6%) since the end of September 2010. Cushing tank farms held actual crude oil inventories of 41.2 million barrels, implying a capacity utilization of 86 percent. Comparing those tank-farm inventories with total crude oil inventories held at Cushing of 42.3 million barrels implies pipeline fill of 1.1 million barrels at end-March. Assuming relatively constant pipeline fill volumes (admittedly a rough assumption), we can estimate tank farm stocks for the end of September at 34.8 million barrels out of total Cushing crude oil inventories of 35.9 million barrels, which implies a storage capacity utilization rate of about 76 percent.
The increase in estimated tank farm capacity utilization from September to March was partly the result of additional Canadian crude oil finding its way to Cushing since Phase II of the Keystone pipeline started commercial operations in February, completing a direct link from the oil sands in Alberta to the Cushing hub. Beginning around that time, Cushing began to see strong inventory builds which lasted through the end of March. Increasing production in the Midwest (PADD II), especially from the Bakken shale, along with well-documented outflow constraints at Cushing, also supported high inventories at the hub in 2011.
Even before EIA published its first storage capacity report, the trade press had been reporting that Cushing storage capacity had been on the rise. In addition, inventories in Cushing have been increasing relative to their historical-seasonal average for most of the past two years, as seen in Figure 1. Increasing inventories at Cushing, along with the almost five-percent increase in storage capacity since September, gives reason to view Cushing inventories relative to historical averages with caution; they demonstrate that market dynamics in the Midwest have been changing quickly, and comparing current inventories to averages which incorporate data from five years ago does not give a complete picture of the market as it currently stands.
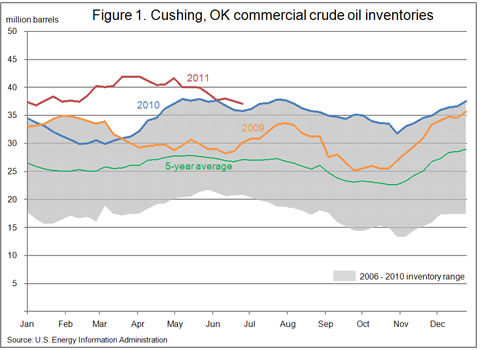
With growing inventories and capacity additions complicating seasonal average inventory comparisons, storage capacity utilization numbers take on greater significance. While capacity utilization increased from September to March, more recently that trend has been reversing. Weekly data indicate that Cushing inventories, since reaching a record high on April 8, have fallen about 4.9 million barrels to 37.0 million barrels as of July 1. While Cushing inventories are now slightly above their year-ago levels, other market factors equal, greater spare storage capacity implies lower marginal storage costs in the area, and therefore, potential relief to downward pressure on WTI. As evidence of easing pressures, the steep contango that was a hallmark of the WTI futures curve in January and February all but vanished, with the front-end of the WTI curve essentially flat in early June, even as near-month prices had returned to levels similar to those of the pre-Libyan crisis period. Despite a pullback in near-month price levels in mid- to late June, time spreads at the front-end of the curve have remained relatively stable.
The issues outlined above are not unique to Cushing. PADD II inventories, excluding those at Cushing, increased 7.2 million barrels (12.7%) from September to March, 4.9 million barrels more than the 5-year average build of 2.3 million barrels over that period. However, refinery and tank farm (excluding Cushing) crude oil storage capacity increased 6.3 million barrels (12.1%) over the same period. Thus, from a utilization standpoint, downward pressures on near term prices in PADD II would appear less intense than might be thought based solely on consideration of inventory levels.
Going forward, storage capacity utilization rates will continue to add context to reported inventory levels. Various trade press sources have reported that additional capacity expansions are planned for Cushing over the second half of 2011 and 2012, which, if realized, may continue to encourage inventory building at somewhat higher rates than suggested by seasonal averages. As such, shifting inventory/storage capacity relationships may have implications for relative crude oil prices or spreads, as well as differentials between the landlocked Cushing hub and competing import markets on the Gulf Coast.
Gasoline price higher for first time in eight weeks while diesel price decreases
The U.S. average retail price of regular gasoline increased for the first time eight weeks, adding a half cent to reach $3.58 per gallon. The average price is $0.85 per gallon higher than last year at this time. While the national average price was up, the only regional increase came in the Midwest where prices jumped more than a dime on the week. In the rest of the regions, prices moved in the other direction. The gasoline average in the Rocky Mountains was down a full nickel, followed by a nearly five-cent drop on the West Coast. West Coast gasoline continues to be the most expensive in the country at $3.75 per gallon. The Gulf Coast price fell three and a half cents to $3.41 per gallon, the lowest average in the country. Rounding out the regions, the East Coast registered a three-cent decline for the week.
The national average diesel price decreased almost four cents this week, falling to $3.85 per gallon. The diesel price is $0.93 per gallon higher than a year ago. The decrease was most pronounced on the West Coast where prices were down almost eight cents and fell below $4.00 per gallon for the first time since February. Diesel prices in all major regions now average less than $4.00 per gallon. Diesel was more than four cents lower on the East Coast, while both the Gulf Coast and Rocky Mountains saw average prices drop between three and four cents. The Midwest average price was more than two cents lower.
Propane inventories continue to grow
U.S. inventories of propane continued to build for the eleventh week in a row, adding another 2.3 million barrels to their seasonal growth to end at 41.5 million barrels. The Midwest region added 1.2 million barrels of propane stocks, while East Coast and Rocky Mountain/West Coast regional stocks each grew by less than 0.1 million barrels to 4.3 million barrels and 1.2 million barrels, respectively. Gulf Coast stocks grew by 1.0 million barrels to 17.7 million barrels. Propylene non-fuel use inventories represented 5.4 percent of total propane inventories.
Text from the previous editions of This Week In Petroleum is accessible through a link at the top right-hand corner of this page.
 |
 |
||||||
| Retail Data | Changes From | Retail Data | Changes From | ||||
| 07/04/11 | Week | Year | 07/04/11 | Week | Year | ||
| Gasoline | 3.579 | Diesel Fuel | 3.850 | ||||
 |
 |
||||||||||||||||||||||||||
|
 |
||||||||||||||||||||||||||
| *Note: Crude Oil Price in Dollars per Barrel. | |||||||||||||||||||||||||||
 |
 |
||||||
 |
 |
||||||
| Stocks Data | Changes From | Stocks Data | Changes From | ||||
| 07/01/11 | Week | Year | 07/01/11 | Week | Year | ||
| Crude Oil | 358.6 | Distillate | 142.1 | ||||
| Gasoline | 212.5 | Propane | 41.508 | ||||