November 17, 2010
(Next Release on November 24, 2010)
Have Crude Oil Prices Moved to a Higher Range?
Since the start of October 2009, the daily closing spot price for West Texas Intermediate (WTI) crude oil has fallen between $70 and $85 dollars per barrel 92 percent of the time. When the WTI spot price did not close within this range since the beginning of October 2009, closing prices above $85 per barrel were a bit more common than those below $70 per barrel. During the past two weeks the closing WTI spot price pushed past $85 on November 4 and closed above $87 per barrel on November 8 through November 10. As seen in Figure 1, oil prices have not been this high since October 2008, at which time they were falling rapidly from historic highs seen earlier that year. With recent spot prices now near or above the $85 level for the longest consecutive stretch since early October 2008, market participants are naturally interested in whether or not the $70 to $85 per barrel price range will remain relevant over the coming months.
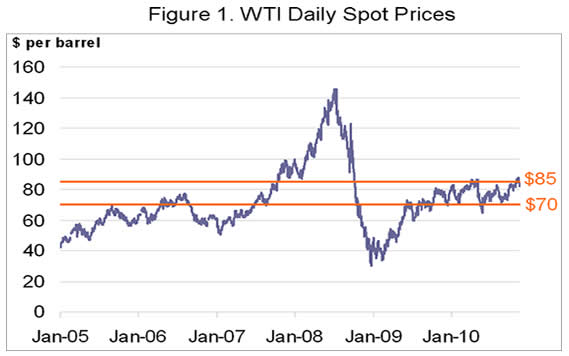
Source: Thomson Reuters
Comparisons between recent movements in the spot prices for WTI and other crude oil streams provide some insight into whether the recent WTI increase is a local phenomenon or reflects global pressures. As illustrated in Figure 2, other closely-watched crude oils have largely kept pace with WTI. The spot price for Brent, the benchmark crude oil for Europe, increased from around $77 per barrel on September 22 to about $88 per barrel on November 10, an increase of $11 per barrel, similar in scope to the $15 increase seen in WTI. The spot price for Dubai crude oil, a benchmark for Asia, increased from about $75 per barrel to over $85 per barrel over the same time period. Meanwhile, the spot price for Malaysia Tapis (another Asian benchmark crude oil) increased from around $81 per barrel to $95 per barrel, nearly the same increase seen in WTI.
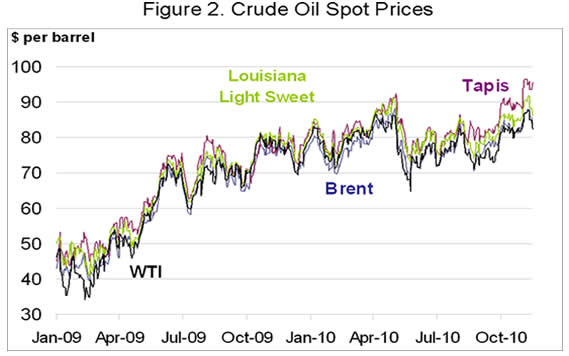
Source: Thomson Reuters
Strong growth in recent global oil consumption, and the expectation that it may continue, is one factor that has contributed to recent crude oil price increases. In the current Short-Term Energy Outlook, projected growth in world real Gross Domestic Product (weighted by oil consumption) is 3.9 percent in 2010. Economic growth this year, particularly in China, is one of the reasons EIA now expects global petroleum consumption to grow 2.0 million barrels per day (the second highest annual growth rate in at least the last decade). While world oil supplies have risen significantly this year, stronger than expected demand growth has generated downward pressure on inventories, especially in regions outside the United States. As an added symptom of a tighter market, numerous reports indicate that floating oil storage is significantly lower than year-ago levels, diminishing a secondary source of supply to the market that was available on short notice.
Ultimately, the future direction of oil prices will depend on how robust the factors driving recent price increases turn out to be.
Retail gasoline and diesel prices increase
The U.S. average retail price for a gallon of gasoline was higher for the third consecutive week, increasing almost 3 cents from last week to $2.89 per gallon, $0.26 per gallon higher than last year at this time. The East Coast saw the largest price increase in the country, with gasoline six cents higher than last week. Prices on the Gulf Coast were up four cents, followed by the West Coast where prices were up three cents. With an average price of $3.11 per gallon, the West Coast is the only region where the price is higher than the national average. Gasoline in the Rocky Mountain region was up a penny versus the week before. Prices in the Midwest moved in the opposite direction of the rest of the country, decreasing a penny from last week.
The average retail diesel price was up more than 6 cents versus last week, with the national average for a gallon of diesel now up to $3.18 per gallon, $0.39 per gallon higher than last year at this time. For the fifth week in a row, diesel increased the most in the Rocky Mountains, surging eight cents from the week before. The East Coast and the Gulf Coast regions both saw increases of about seven cents. Prices in the Midwest were up six and a half cents. On the West Coast, prices gained nearly six cents, rounding out a week when all of the regions saw diesel prices increase more than a nickel.
Residential Heating Fuel Prices Increase
Residential heating oil prices increased during the period ending November 15, 2010. The average residential heating oil price increased by approximately $0.05 per gallon last week to reach $3.13 per gallon, an increase of over $0.38 per gallon from the same time last year. Wholesale heating oil prices decreased by almost $0.01 per gallon last week, reaching a price just shy of $2.45 per gallon. This is $0.40 per gallon higher than last year�s price.
The average residential propane price increased by $0.02 per gallon to reach $2.52 per gallon. This was an increase of $0.28 per gallon compared to the $2.24 per gallon average from the same period last year. Wholesale propane prices decreased by about $0.02 per gallon, from about $1.34 per gallon to $1.32 per gallon. This was an increase of $0.15 per gallon when compared to the November 16, 2009 price of $1.17 per gallon.
Stocks of Propane Post a Gain
Inventories of propane in the United States experienced a counter-seasonal build last week, growing by 0.9 million barrels to end at 64.8 million barrels total. The build occurred in all regions across the country. The largest gains were in the East Coast and Gulf Coast regions, each adding about 0.4 million barrels of propane inventory. The Midwest region gained almost 0.2 million barrels of propane stocks and the Rocky Mountain/West Coast region was up slightly. Propylene non-fuel use inventories represented 3.3 percent of total propane inventories.
Text from the previous editions of This Week In Petroleum is accessible through a link at the top right-hand corner of this page.
| Retail Prices (Dollars per Gallon) | |||||||
 |
 |
||||||
 |
 |
||||||
| Retail Data | Changes From | Retail Data | Changes From | ||||
| 11/15/10 | Week | Year | 11/15/10 | Week | Year | ||
| Gasoline | 2.892 | Heating Oil | 3.125 | ||||
| Diesel Fuel | 3.184 | Propane | 2.523 | ||||
| Futures Prices (Dollars per Gallon*) | |||||||||||||||||||||||||||
 |
 |
||||||||||||||||||||||||||
|
 |
||||||||||||||||||||||||||
| *Note: Crude Oil Price in Dollars per Barrel. | |||||||||||||||||||||||||||
| Stocks (Million Barrels) | |||||||
 |
 |
||||||
 |
 |
||||||
| Stocks Data | Changes From | Stocks Data | Changes From | ||||
| 11/12/10 | Week | Year | 11/12/10 | Week | Year | ||
| Crude Oil | 357.6 | Distillate | 158.8 | ||||
| Gasoline | 207.7 | Propane | 64.776 | ||||