Released on May 26, 2010
(Next Release on June 3, 2010)
Production, Proved Reserves and Drilling in the Ultra-Deepwater Gulf of Mexico
The oil spill following the April 20 explosion aboard the Deepwater Horizon drilling rig and its subsequent loss, has focused public attention on ultra-deepwater production and its role in the overall supply mix. The ultra-deepwater (water depth of at least 5,000 feet) portion of the Gulf of Mexico Federal Offshore (GOM Fed) has been growing as a domestic source of crude oil over the last few years, both for production and proved reserves, but it remains a relatively small source of natural gas. While Federal offshore drilling in the Gulf of Mexico stretches along the coasts of Texas, Louisiana, Mississippi and Alabama, ultra-deepwater production so far has been concentrated in the eastern part of the developed areas (see Figure 1).
Figure 1. Production, Proved Reserves and Drilling in the Ultra-Deepwater
Click Map to Enlarge

Source: Energy Information Administration based on data from MMS, HPDI
Production
In 2009, the GOM Fed accounted for 29 percent of the Nation’s oil production and 11 percent of its natural gas production. About a third of GOM Fed oil production came from wells in the ultra-deepwater (about 9 percent of U.S. total oil production); about a quarter of GOM Fed natural gas production came from wells in the ultra-deepwater (about 3 percent of the U.S. total; see Table 1).
|
Table 1. Production by Water Depth in the Mexico Federal Offshore, 2009 |
|||||||
|
Water
Depth (Feet) |
Designation |
Oil
(million
barrels) |
%
GOM Fed |
%
Total |
Natural
Gas (Billion cubic feet) |
%
GOM Fed |
%
Total |
|
|
|
112 |
19.8% |
5.8% |
1,340 |
54.9% |
6.1% |
|
|
Deepwater |
273 |
48.1% |
14.1% |
531 |
21.7% |
2.4% |
|
5,000+ |
Ultra-Deepwater |
182 |
32.1% |
9.4% |
571 |
23.4% |
2.6% |
|
All
Depths |
Total
GOM Fed |
567 |
100.0% |
29.3% |
2,442 |
100.0% |
11.2% |
|
Sources: Minerals Management Service, EIA Office of Oil and Gas. Oil includes lease condensate; natural gas includes plant liquids. Total U.S. natural gas production is based on marketed production. Note: Data are preliminary; they differ slightly (less than 2 percent annually) from data published in the Petroleum Supply Monthly and the Natural Gas Monthly because of different updating schedules. |
|||||||
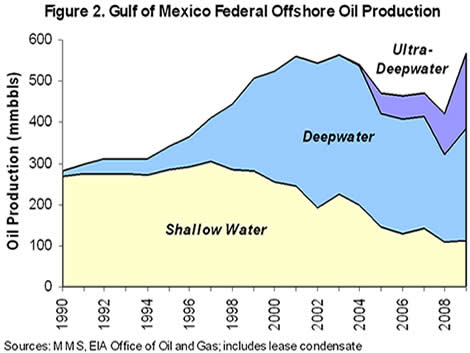
The GOM Fed ultra-deepwater production has become significant only in recent years (Figure 2). GOM oil production began from shallow water fields (water depth of under 1,000 feet) but shallow water production began to fall in 1998. Steadily increasing volumes from deepwater fields (water depths between 1,000 and 4,999 feet) offset these declines until 2004, after which deepwater production also began to decline. But, ultra-deepwater production (water depths more than 5,000 feet) has risen dramatically since 2004 (and more than tripled since 2005), stemming the overall decline in GOM Fed production. A trio of high-profile ultra-deepwater discoveries - Atlantis, Thunder Horse, and Great White (part of the Perdido development) - has recently started producing. Several more are in various stages of development.
For natural gas, the GOM Fed’s importance has been falling. During the 1990s, the region accounted for about 25 percent of total U.S. natural gas production. By 2009, GOM Fed natural gas production had fallen to 11 percent of the Nation’s total. Ultra-deepwater production was about a quarter of that total, accounting for only about 3 percent of total U.S. production.
Proved Reserves
At the end of 2008, the GOM Fed accounted for about one-fifth of oil proved reserves and just over five percent of natural gas proved reserves. The increasing importance of the ultra-deepwater oil is also clear for proved reserves. Fully 40 percent of GOM Fed oil proved reserves were in the ultra-deepwater at the end of 2008 – over 7 percent of total U.S. oil proved reserves (see Table 2).
|
Table 2.
Proved Reserves by Water Depth in the |
|||||||
|
Water
Depth (Feet) |
Designation |
Oil
(mmbbls) |
%
GOM Fed |
%
Total |
Natural
Gas (Bcf) |
%
GOM Fed |
%
Total |
|
|
Shallow
Water |
719 |
19.1% |
3.5% |
7,112 |
53.9% |
2.8% |
|
|
Deepwater |
1,538 |
40.8% |
7.5% |
3,881 |
29.4% |
1.5% |
|
5,000+ |
Ultra-Deepwater |
1,516 |
40.2% |
7.4% |
2,194 |
16.6% |
0.9% |
|
All
Depths |
Total
GOM Fed |
3,773 |
100.0% |
18.4% |
13,187 |
100.0% |
5.2% |
|
Source: EIA Office of Oil and Gas. Oil includes lease condensate; natural gas includes plant liquids. |
|||||||
For natural gas, the picture is different. Only a sixth of GOM Fed proved reserves are in the ultra-deepwater, and they account for only about 1 percent of the U.S. total. Steadily increasing production and proved reserves associated with onshore shale gas formations contribute to reducing the relative importance of GOM Fed supplies.
Drilling
Between 2004 and 2008, operators drilled a total of 656 deepwater wells (for both crude oil and natural gas) in the GOM Fed, 226 of which were in the ultra-deepwater (34 percent). The majority of these wells were exploratory, but development wells accounted for about 30 percent (see Table 3).
|
Table
3. |
||||||
|
|
Exploratory
Wells |
Development
Wells |
||||
|
Year |
Deepwater |
Ultra-Deep |
Total |
Deepwater |
Ultra-Deep |
Total |
|
2004 |
54 |
36 |
90 |
29 |
30 |
59 |
|
2005 |
68 |
25 |
93 |
26 |
1 |
27 |
|
2006 |
65 |
35 |
100 |
27 |
7 |
34 |
|
2007 |
66 |
29 |
95 |
21 |
29 |
50 |
|
2008 |
53 |
32 |
85 |
21 |
2 |
23 |
|
Total |
306 |
157 |
463 |
124 |
69 |
193 |
|
Source: Minerals Management Service |
|
|
|
|||
U.S. Average Gasoline and Diesel Fuel Prices Drop Sharply
In the largest weekly decrease since July 13, 2009, the U.S. average price for regular gasoline dropped almost eight cents to $2.79 per gallon, $0.35 higher than last year at this time. Prices fell in all regions of the country, with the largest drop taking place in the Midwest and the smallest occurring in the Rocky Mountains. The East Coast average went down seven cents to $2.79 per gallon while the price in the Midwest plunged eleven cents to $2.69 per gallon. The Gulf Coast average fell six cents to $2.70 per gallon and the Rocky Mountains price went down over four cents to $2.85 per gallon. The West Coast price declined six cents to $3.01 per gallon and the average in California dropped seven cents to $3.05 per gallon.
The national average price for diesel fuel fell seven cents to $3.02 per gallon, the largest one-week decline since December 15, 2008 but still $0.75 cents higher than last year at this time. Prices fell in all regions of the country, with the largest drop occurring in the Midwest and the smallest in the Rocky Mountains. The price on the East Coast fell seven cents to $3.04 per gallon. The average in the Midwest plummeted eight cents to $2.99 per gallon. Dropping six and a half cents, the average on the Gulf Coast settled at $2.98 per gallon. The Rocky Mountain price dropped a nickel to $3.11 per gallon. On the West Coast, the average went down seven cents to $3.13 per gallon, while the California price fell nearly eight cents to $3.16 per gallon.
Stocks of Propane Rose Slightly Last Week
Inventories of propane built only slightly last week, gaining 0.2 million barrels to end at 39.7 million barrels total, but still landing propane inventories in the upper half of average range for this time of year. The Gulf Coast was the only region to add inventory, gaining 0.5 million barrels. The Midwest regional stocks fell by 0.2 million barrels while the East Coast regional stocks dropped 0.1 million barrels. The Rocky Mountain/West Coast region was down slightly. Propylene non-fuel use inventories decreased their share of total propane/propylene stocks from 7.6 percent to 7.4 percent.
Text from the previous editions of “This Week In Petroleum” is accessible through a link at the top right-hand corner of this page.
| Retail Prices (Cents Per Gallon) | |||||||
 |
 |
||||||
| Retail Data | Changes From | Retail Data | Changes From | ||||
| 05/24/10 | Week | Year | 05/24/10 | Week | Year | ||
| Gasoline | 278.6 | Diesel Fuel | 302.1 | ||||
| Spot Prices (Cents Per Gallon*) | |||||||||||||||||||||||||||||||||||
 |
 |
||||||||||||||||||||||||||||||||||
 |
 |
||||||||||||||||||||||||||||||||||
|
 |
||||||||||||||||||||||||||||||||||
| *Note: Crude Oil WTI Price in Dollars per Barrel. | |||||||||||||||||||||||||||||||||||
| Stocks (Million Barrels) | |||||||
 |
 |
||||||
 |
 |
||||||
| Stocks Data | Changes From | Stocks Data | Changes From | ||||
| 05/21/10 | Week | Year | 05/21/10 | Week | Year | ||
| Crude Oil | 365.1 | Distillate | 152.5 | ||||
| Gasoline | 221.6 | Propane | 39.709 | ||||