In the News:
Mexico’s natural gas consumption declines amid COVID-19 mitigation efforts
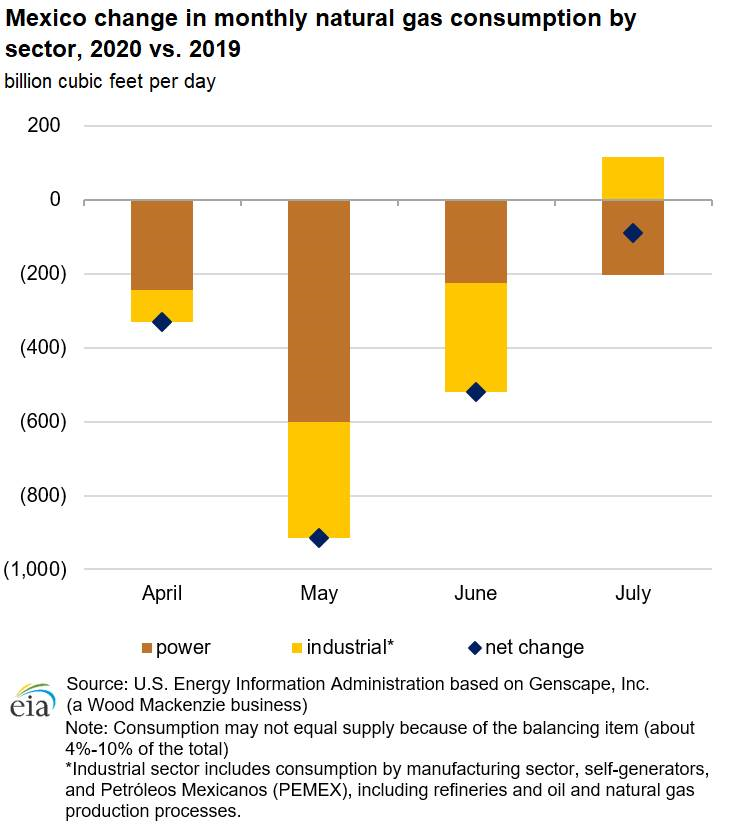
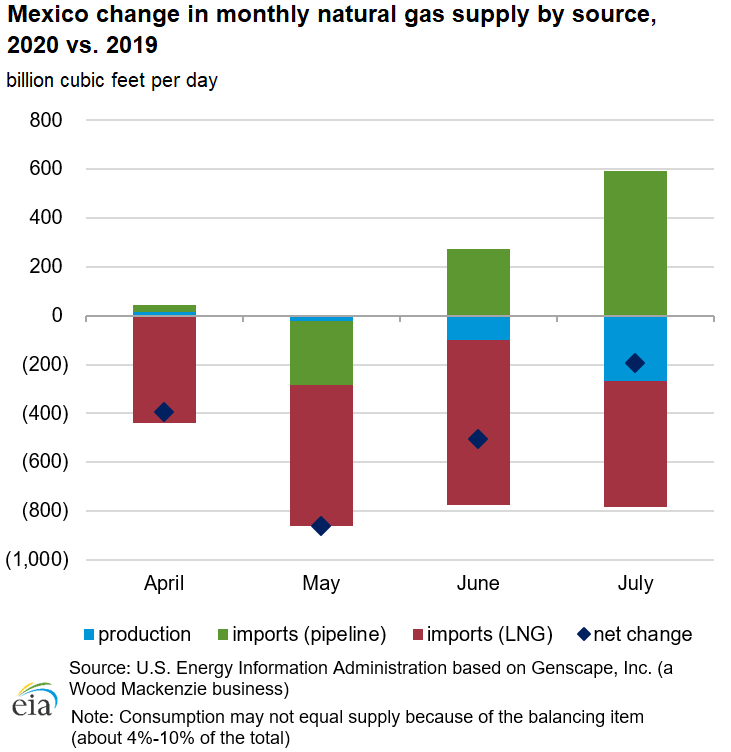
Since the onset of the coronavirus disease 2019 (COVID-19) pandemic, natural gas consumption in Mexico has declined. Natural gas is consumed in Mexico primarily in the power and industrial sectors. Social distancing measures and a decline in tourism reduced natural gas consumption across these sectors. According to natural gas pipeline flow data provided by Genscape, Inc. (a Wood Mackenzie business), total natural gas consumption in Mexico averaged 8.2 billion cubic feet per day (Bcf/d) in April–July of this year, 5% (0.5 Bcf/d) lower than during the same period last year, as lockdown measures and general economic slowdown reduced consumption, particularly in the power generation sector. Total supply averaged 8.0 Bcf/d, 6% (0.5 Bcf/d) lower than during the same period last year, with the largest year-on-year decline in imports of liquefied natural gas (LNG) over this period.
Consumption. The largest reductions in natural gas consumption in Mexico occurred in May 2020, when consumption across all sectors averaged 7.8 Bcf/d, 10% (0.9 Bcf/d) lower than in May 2019. The largest decline was in natural gas consumption by natural gas-fired power plants, averaging 14% (0.6 Bcf/d) lower. The electric generation load across all of Mexico declined by 11% in May 2020 (3.1 terawatthours (TWh)) compared to May 2019 as Mexico implemented lockdown measures to contain the spread of COVID-19. A large portion of electricity demand in Mexico is generated by the tourism industry, which contributes 17% to Mexico’s gross domestic product (GDP). The reduction in trade, tourism, and other economic activities led to a significant reduction in overall electricity demand, which declined by 7.4 TWh (7%) in April–July 2020 compared to the same period in 2019. Industrial sector consumption also declined in April–June 2020, averaging 5% lower than during the same period last year, but it has begun to gradually recover since July.
Supply. Domestic production of natural gas in Mexico has not been significantly affected by the COVID-19 pandemic. The largest decline in Mexico’s natural gas supply mix was in LNG imports, which have declined every month since March 2020 despite all-time historical low global LNG prices. In particular, LNG imports declined at the Manzanillo LNG terminal on the west coast of Mexico, which supplies LNG to Mexico City and Guadalajara, two of Mexico’s largest metropolitan areas. Both Mexico City and Guadalajara historically depended on LNG imports from Manzanillo terminal to meet some of their natural gas supply requirements. Since commissioning several pipelines of the Wahalajara pipeline system, which connects natural gas supply from the Waha area in the United States to Mexico’s central and western regions, pipeline imports have begun to displace LNG imports at Manzanillo terminal. LNG imports at Mexico’s LNG terminal on the east coast—Altamira—have been largely displaced by pipeline imports from the United States since October 2019 following the commissioning of the Sur de Texas-Tuxpan pipeline in September 2019. Altamira terminal had no LNG imports from November 2019 to April 2020 and imported only 3 cargoes since then (in May, June, and August).
Overview:
(For the week ending Wednesday, August 26, 2020)
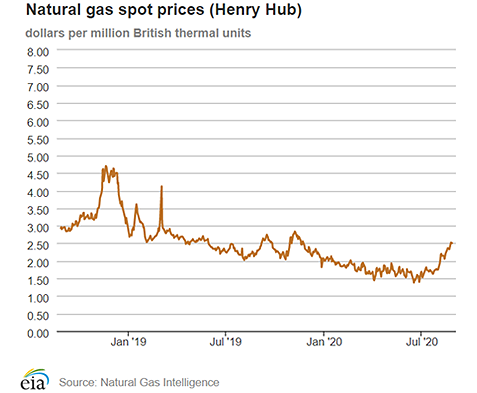
- Natural gas spot prices rose at most locations this report week (Wednesday, August 19 to Wednesday, August 26). The Henry Hub spot price rose from $2.36 per million British thermal units (MMBtu) last Wednesday to $2.51/MMBtu yesterday.
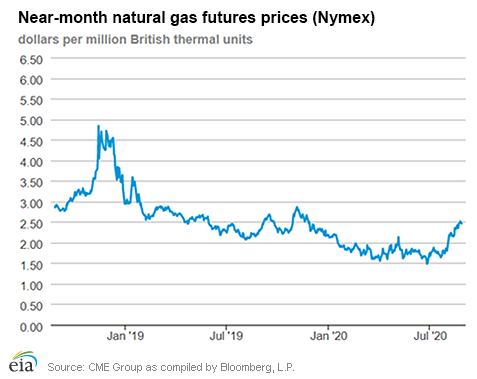
- At the New York Mercantile Exchange (Nymex), the price of the September 2020 contract increased 3¢, from $2.426/MMBtu last Wednesday to $2.461/MMBtu yesterday. The price of the 12-month strip averaging September 2020 through August 2021 futures contracts declined 1¢/MMBtu to $2.851/MMBtu.
- The net injections to working gas totaled 45 billion cubic feet (Bcf) for the week ending August 21. Working natural gas stocks totaled 3,420 Bcf, which is 20% more than the year-ago level and 15% more than the five-year (2015–19) average for this week.
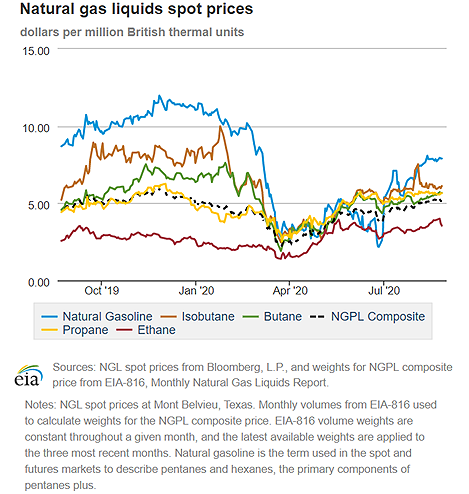
- The natural gas plant liquids composite price at Mont Belvieu, Texas, rose by 1¢/MMBtu, averaging $5.19/MMBtu for the week ending August 26. The prices of propane and isobutane fell by 1% and 2%, respectively. The prices of ethane and butane rose by 1% and 3%, respectively. The price of natural gasoline remained flat week over week.
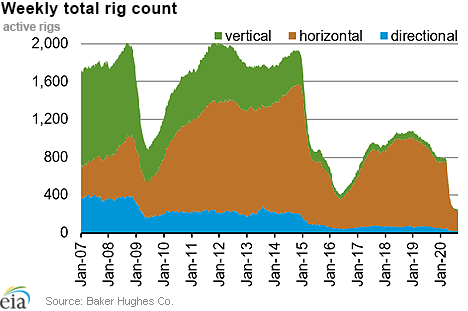
- According to Baker Hughes, for the week ending Tuesday, August 18, the natural gas rig count decreased by 1 to 69. The number of oil-directed rigs rose by 11 to 183. The total rig count increased by 10, and it now stands at 254.
Prices/Supply/Demand:
Prices rise in most demand hubs with storm activity in the Gulf of Mexico. This report week (Wednesday, August 19 to Wednesday, August 26), the Henry Hub spot price rose 15¢ from $2.36/MMBtu last Wednesday to $2.51/MMBtu yesterday, after reaching a high of $2.52/MMBtu on Monday and Tuesday. Temperatures across the Lower 48 states were generally warmer than normal, but cooler than normal on the Gulf Coast. At the Chicago Citygate, the price increased 10¢ from $2.23/MMBtu last Wednesday to $2.33/MMBtu yesterday.
Hurricane Laura makes landfall in Southwestern Louisiana, affecting key natural gas infrastructure. Hurricane Laura made landfall early this morning as a strong Category 4 storm. Laura struck close to the Louisiana-Texas border, home to key U.S. energy infrastructure. According to the Bureau of Safety and Environmental Enforcement (BSEE), as of yesterday, BSEE estimates that approximately 61% of natural gas production and 84% percent of the current oil production in the Gulf of Mexico has been shut-in based on operator reports, resulting from the evacuation of nearly half of the manned platforms. According to Genscape, operational flow orders or force majeures have been issued on the ANR, Cameron, Columbia Gulf, Kinder Morgan Louisiana, and Natural Gas Pipeline Co. of America systems. Cameron and Sabine Pass liquefied natural gas (LNG) export terminals were completely offline as of early Thursday. These disruptions further reduced LNG feedstock, which averaged 4.3 Bcf/d, or 0.3 Bcf/d lower than last week, and fell to as low as 2.3 Bcf/d on Wednesday ahead of Hurricane Laura making landfall.
The U.S. Energy Information Administration’s (EIA) Energy Disruptions map shows storm-related geographic data (also referred to as map layers) from the National Hurricane Center and the National Weather Service and EIA's map layers for energy-related infrastructure such as LNG export terminals, natural gas processing plants, natural gas pipelines, high-voltage transmission lines, and power plants.
California prices are mixed as the state continues to battle wildfires. The price at PG&E Citygate in Northern California rose 19¢, up from $3.31/MMBtu last Wednesday to a high of $3.50/MMBtu yesterday. The price at SoCal Citygate in Southern California decreased $1.54 from a high of $6.15/MMBtu last Wednesday to $4.61/MMBtu yesterday as temperatures began to moderate toward the end of the report week. As of yesterday, California continued to battle more than two dozen active wildfires. Natural gas stocks in the Southern California Gas (SoCalGas) system declined 0.7 Bcf over the report week and are down 4.6 Bcf compared to late July, when stocks were at their highest point of the summer.
Northeast prices rise. At the Algonquin Citygate, which serves Boston-area consumers, the price went up 21¢ from a low of $1.31/MMBtu last Wednesday to $1.52/MMBtu yesterday as Boston-area temperatures were warmer than normal, approaching 90 degrees Fahrenheit on multiple days during the report week. At the Transcontinental Pipeline Zone 6 trading point for New York City, the price increased 79¢ from a low of $1.19/MMBtu last Wednesday to a high of $1.98/MMBtu yesterday.
The Tennessee Zone 4 Marcellus spot price increased 15¢ from $1.07/MMBtu last Wednesday to $1.22/MMBtu yesterday. The price at Dominion South in southwest Pennsylvania rose 22¢ from $1.14/MMBtu last Wednesday to $1.36/MMBtu yesterday.
Permian Basin prices are down. The price at the Waha Hub in West Texas, which is located near Permian Basin production activities, averaged $1.65/MMBtu last Wednesday, 71¢/MMBtu lower than the Henry Hub price. Yesterday, the price at the Waha Hub averaged a low of $1.07/MMBtu, $1.44/MMBtu lower than the Henry Hub price.
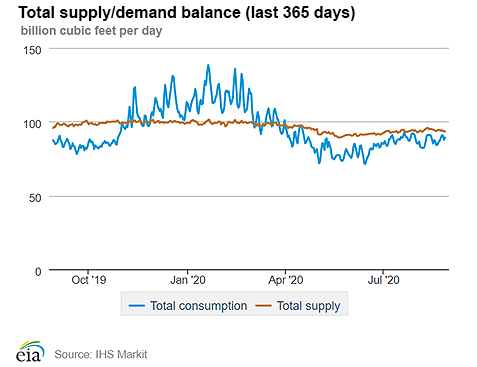
Supply falls slightly. According to data from IHS Markit, the average total supply of natural gas fell by 0.5% compared with the previous report week. Dry natural gas production decreased by 1.0% compared with the previous report week amidst shut-in natural gas production in the Gulf of Mexico. Average net imports from Canada increased by 10.3% from last week but remain a relatively small component of supply.
Demand rises, driven by increased power generation. Total U.S. consumption of natural gas rose by 0.8% compared with the previous report week, according to data from IHS Markit. Natural gas consumed for power generation climbed by 1.3% week over week. In the residential and commercial sectors, consumption increased by 0.8%. Industrial sector consumption decreased by 0.2% week over week. Natural gas exports to Mexico increased 8.0%.
U.S. LNG exports decrease week over week. Seven LNG vessels (two each from Sabine Pass and Cameron, and one each from Freeport, Corpus Christi, and Cove Point) with a combined LNG-carrying capacity of 26 Bcf departed the United States between August 20 and August 26, 2020, according to shipping data provided by Marine Traffic.
Two U.S. LNG liquefaction facilities—Sabine Pass and Cameron—are located in the direct path of Hurricane Laura. Both facilities have suspended operations and implemented a controlled shutdown, according to reporting by Bloomberg L.P.
Storage:
The net injections into storage totaled 45 Bcf for the week ending August 21, compared with the five-year (2015–19) average net injections of 49 Bcf and last year's net injections of 60 Bcf during the same week. Working natural gas stocks totaled 3,420 Bcf, which is 438 Bcf more than the five-year average and 580 Bcf more than last year at this time.
According to The Desk survey of natural gas analysts, estimates of the weekly net change to working natural gas stocks ranged from net injections of 37 Bcf to 58 Bcf, with a median estimate of 45 Bcf.
The average rate of injections into storage is 10% higher than the five-year average so far in the refill season (April through October). If the rate of injections into storage matched the five-year average of 10.4 Bcf/d for the remainder of the refill season, the total inventory would be 4,161 Bcf on October 31, which is 438 Bcf higher than the five-year average of 3,723 Bcf for that time of year.
More storage data and analysis can be found on the Natural Gas Storage Dashboard and the Weekly Natural Gas Storage Report.
See also:
| Spot Prices ($/MMBtu) | Thu, 20-Aug |
Fri, 21-Aug |
Mon, 24-Aug |
Tue, 25-Aug |
Wed, 26-Aug |
|---|---|---|---|---|---|
| Henry Hub |
2.35 |
2.33 |
2.52 |
2.52 |
2.51 |
| New York |
1.21 |
1.29 |
1.89 |
1.65 |
1.98 |
| Chicago |
2.20 |
2.15 |
2.40 |
2.38 |
2.33 |
| Cal. Comp. Avg.* |
3.10 |
2.79 |
3.21 |
3.35 |
3.26 |
| Futures ($/MMBtu) | |||||
| September contract | 2.352 |
2.448 |
2.513 |
2.489 |
2.461 |
| October contract |
2.503 |
2.573 |
2.616 |
2.596 |
2.574 |
| *Avg. of NGI's reported prices for: Malin, PG&E Citygate, and Southern California Border Avg. | |||||
| Source: NGI's Daily Gas Price Index | |||||
| U.S. natural gas supply - Gas Week: (8/20/20 - 8/26/20) | |||
|---|---|---|---|
Average daily values (Bcf/d): |
|||
this week |
last week |
last year |
|
| Marketed production | 100.1 |
101.2 |
105.8 |
| Dry production | 88.6 |
89.5 |
93.0 |
| Net Canada imports | 5.4 |
4.9 |
4.5 |
| LNG pipeline deliveries | 0.1 |
0.1 |
0.1 |
| Total supply | 94.0 |
94.5 |
97.6 |
|
Source: IHS Markit | |||
| U.S. natural gas consumption - Gas Week: (8/20/20 - 8/26/20) | |||
|---|---|---|---|
Average daily values (Bcf/d): |
|||
this week |
last week |
last year |
|
| U.S. consumption | 70.8 |
70.3 |
69.0 |
| Power | 41.7 |
41.1 |
39.7 |
| Industrial | 20.7 |
20.7 |
21.4 |
| Residential/commercial | 8.4 |
8.4 |
8.0 |
| Mexico exports | 6.1 |
5.6 |
5.5 |
| Pipeline fuel use/losses | 6.8 |
6.9 |
6.5 |
| LNG pipeline receipts | 4.2 |
4.7 |
6.3 |
| Total demand | 87.9 |
87.5 |
87.3 |
|
Source: IHS Markit | |||
| Rigs | |||
|---|---|---|---|
Tue, August 18, 2020 |
Change from |
||
last week |
last year |
||
| Oil rigs | 183 |
6.4% |
-75.7% |
| Natural gas rigs | 69 |
-1.4% |
-57.4% |
| Note: Excludes any miscellaneous rigs | |||
| Rig numbers by type | |||
|---|---|---|---|
Tue, August 18, 2020 |
Change from |
||
last week |
last year |
||
| Vertical | 13 |
0.0% |
-74.0% |
| Horizontal | 221 |
6.8% |
-72.3% |
| Directional | 20 |
-16.7% |
-71.0% |
| Source: Baker Hughes Co. | |||
| Working gas in underground storage | ||||
|---|---|---|---|---|
Stocks billion cubic feet (Bcf) |
||||
| Region | 2020-08-21 |
2020-08-14 |
change |
|
| East | 775 |
750 |
25 |
|
| Midwest | 904 |
880 |
24 |
|
| Mountain | 212 |
209 |
3 |
|
| Pacific | 306 |
313 |
-7 |
|
| South Central | 1,223 |
1,223 |
0 |
|
| Total | 3,420 |
3,375 |
45 |
|
|
Source: Form EIA-912, Weekly Underground Natural Gas Storage Report | ||||
| Working gas in underground storage | |||||
|---|---|---|---|---|---|
Historical comparisons |
|||||
Year ago (8/21/19) |
5-year average (2015-2019) |
||||
| Region | Stocks (Bcf) |
% change |
Stocks (Bcf) |
% change |
|
| East | 676 |
14.6 |
709 |
9.3 |
|
| Midwest | 781 |
15.7 |
783 |
15.5 |
|
| Mountain | 172 |
23.3 |
187 |
13.4 |
|
| Pacific | 277 |
10.5 |
294 |
4.1 |
|
| South Central | 934 |
30.9 |
1,009 |
21.2 |
|
| Total | 2,840 |
20.4 |
2,982 |
14.7 |
|
| Source: Form EIA-912, Weekly Underground Natural Gas Storage Report | |||||
| Temperature – heating & cooling degree days (week ending Aug 20) | ||||||||
|---|---|---|---|---|---|---|---|---|
HDD deviation from: |
CDD deviation from: |
|||||||
| Region | HDD Current |
normal |
last year |
CDD Current |
normal |
last year |
||
| New England | 3 |
-1 |
3 |
28 |
-4 |
-27 |
||
| Middle Atlantic | 1 |
-2 |
1 |
44 |
-2 |
-34 |
||
| E N Central | 5 |
-1 |
3 |
40 |
-4 |
-19 |
||
| W N Central | 2 |
-4 |
0 |
51 |
-7 |
-10 |
||
| South Atlantic | 0 |
0 |
0 |
89 |
0 |
-23 |
||
| E S Central | 0 |
0 |
0 |
85 |
0 |
-21 |
||
| W S Central | 0 |
0 |
0 |
129 |
9 |
-19 |
||
| Mountain | 0 |
-7 |
0 |
103 |
34 |
15 |
||
| Pacific | 0 |
-4 |
0 |
101 |
58 |
48 |
||
| United States | 2 |
-2 |
1 |
76 |
9 |
-9 |
||
|
Note: HDD = heating degree day; CDD = cooling degree day Source: National Oceanic and Atmospheric Administration | ||||||||
Average temperature (°F)
7-day mean ending Aug 20, 2020
Source: National Oceanic and Atmospheric Administration
Deviation between average and normal (°F)
7-day mean ending Aug 20, 2020
Source: National Oceanic and Atmospheric Administration