In the News:
Winter Fuels Outlook projects higher domestic natural gas demand and prices
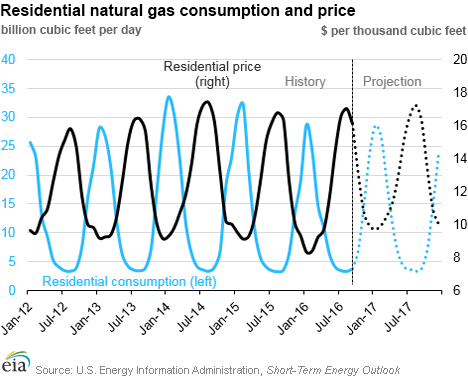
EIA's Winter Fuels Outlook, released earlier today, forecasts residential consumption will average 61.3 thousand cubic feet (Mcf) per household over October 2016 through March 2017, 10% higher than last winter. U.S. natural gas consumption peaks during the winter season, with nearly half of U.S. homes using natural gas as their primary heating fuel. The increase in consumption compared to last winter is based on a return to temperatures that are closer to normal. Last winter's El Niño weather pattern resulted in winter temperatures that were 15% warmer than the previous 10-year average.
EIA forecasts gas prices will average $10.37/Mcf, 11% higher than last winter and the highest since the winter of 2010–11. EIA expects households heating primarily with natural gas to spend $116 (22%) more this winter compared with last winter, a result of the higher prices and increased natural gas consumption. However, the forecast average expenditures of households heating with natural gas are comparable to those in the five winters prior to 2015–16.
EIA's Winter Fuels Outlook, which includes scenarios where temperatures are 10% above and below current forecast levels, is a supplement to EIA's Short-Term Energy Outlook (STEO). This month's STEO also includes a change in the analysis presented in the text of the monthly report, based on feedback from EIA's readers. The text of the report will now focus more attention on current developments in oil and natural gas markets. The tables and charts presenting the forecasts will remain the same.
Overview:
(For the Week Ending Wednesday, October 12, 2016)
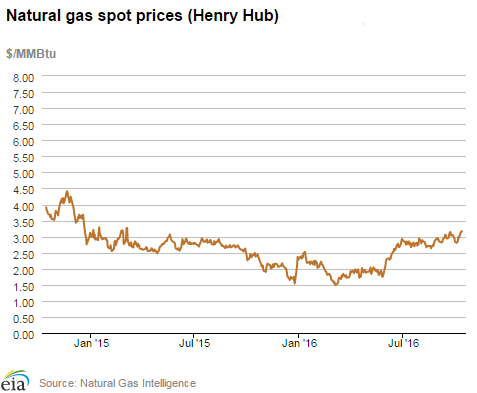
- Natural gas spot prices at most locations were up this report week (Wednesday, October 5 to Wednesday, October 12). The Henry Hub spot price rose from $2.86 per million British thermal units (MMBtu) last Wednesday to $3.17/MMBtu yesterday.
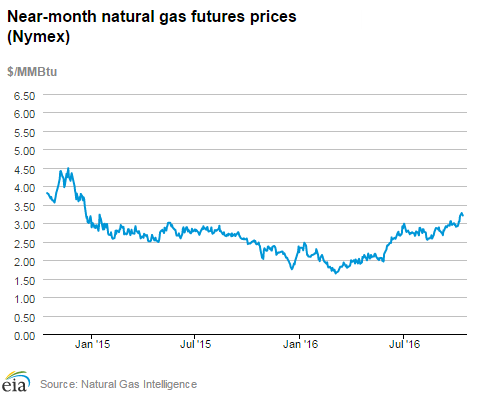
- At the Nymex, the price of the November 2016 contract increased 17¢, from $3.041/MMBtu last Wednesday to $3.210/MMBtu yesterday. The price of the 12-month strip averaging November 2016 through October 2017 futures contracts climbed 13¢ to $3.312/MMBtu.
- Net injections to working gas totaled 79 billion cubic feet (Bcf) for the week ending October 7. Working natural gas stocks are 3,759 Bcf, which is 2% greater than the year-ago level and 5% greater than the five-year (2011–15) average for this week.
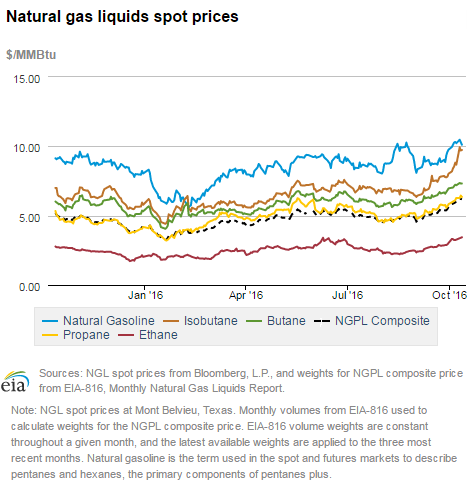
- The natural gas plant liquids composite price at Mont Belvieu, Texas, rose by 46¢, closing at $5.91/MMBtu for the week ending October 7. The prices of natural gasoline, ethane, propane, butane, and isobutane all rose, increasing by 9%, 12%, 7%, 5%, and 9%, respectively.
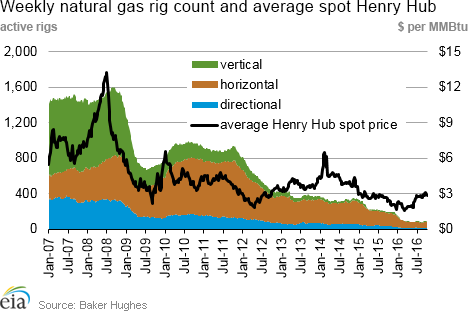
- According to Baker Hughes, for the week ending Friday, October 7, the natural gas rig count decreased by 2 to 94. The number of oil-directed rigs rose by 3 to 428. The number of miscellaneous rigs went up by 1 during the week. The total rig count climbed by 2, and now stands at 524.
Prices/Supply/Demand:
Prices rise nearly everywhere. This report week (Wednesday, October 5 to Wednesday, October 12), the Henry Hub spot price rose 31¢ from $2.86/MMBtu last Wednesday to $3.17/MMBtu yesterday. Despite the high levels of natural gas storage stocks, prices seem to be elevated on increasing demand, which may be related to a cold front moving south across the Canadian border, as well as to overall higher levels of electric-sector demand for natural gas this year.
At the Chicago Citygate, prices increased 34¢ from $2.81/MMBtu last Wednesday to $3.15/MMBtu yesterday. Prices at PG&E Citygate in Northern California gained 8¢, up from $3.29/MMBtu last Wednesday to $3.37/MMBtu yesterday. The price at SoCal Citygate rose 13¢ from $2.90/MMBtu last Wednesday to $3.03/MMBtu yesterday. At the Algonquin Citygate, which serves Boston-area consumers, prices went up 25¢ from $2.45/MMBtu last Wednesday to $2.70/MMBtu yesterday.
New York City price hovers around $1.00/MMBtu. After hitting an all-time low of 41¢/MMBtu on Friday, September 30, the Transco Zone 6 price, which serves New York City customers, hovered around $1.00/MMBtu for most of the week. The price fell slightly over the report period, moving from $1.07/MMBtu last Wednesday to $1.04/MMBtu yesterday.
Hurricane Matthew impacts Florida and southeastern states. Hurricane Matthew, a category 4 hurricane, hit Florida over the weekend and began making its way up the coast. The Governor of Florida ordered the evacuation of 1.5 million residents, and the National Guard stood ready to respond for relief efforts. Significant power outages occurred, and more than 2 million customers were without electricity on October 9, which was the peak of the electric grid disruption. Outages reached as far north as Virginia. As of yesterday, nearly 400,000 customers had not yet had their power restored.
November futures up. At the Nymex, the price of the November 2016 contract increased 17¢, from $3.041/MMBtu last Wednesday to $3.210/MMBtu yesterday. Similarly, the price of the 12-month strip, averaging November 2016 through October 2017 futures contracts, climbed 13¢ to $3.312/MMBtu.
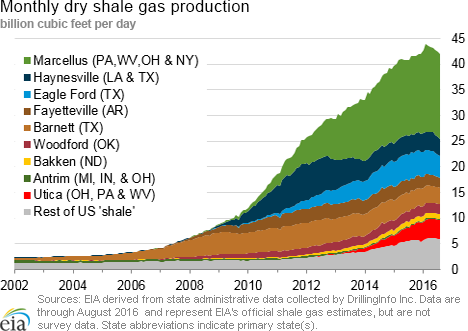
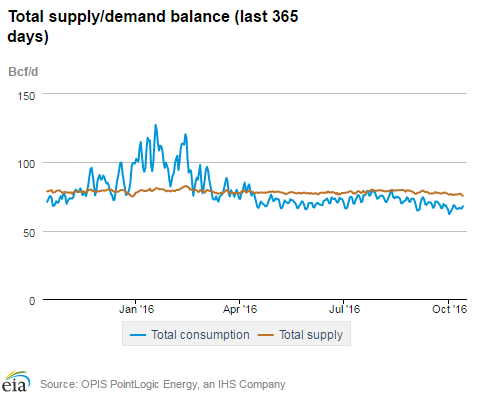
Supply flat. According to data from PointLogic, the average total supply of natural gas remained the same as the previous week. Dry natural gas production levels were constant week over week, whereas net imports from Canada decreased by 1% from last week.
Consumption rises. Total U.S. consumption of natural gas rose by 2% compared with the previous report week, according to data from PointLogic. Power burn rose by 2%, and industrial sector consumption increased by 1% week over week. In the residential and commercial sectors, consumption rose by 3%. Hurricane Matthew likely induced some amount of demand destruction as consumers in the southeastern United States consumed less natural gas for electricity generation because of power outages. Natural gas exports to Mexico decreased 4%.
U.S. LNG exports. There were no pipeline deliveries to the Sabine Pass liquefaction terminal. The facility is currently in the third week of a four-week planned maintenance of Trains 1 and 2. On October 12, Federal Energy Regulatory Commission (FERC) authorized terminal's developer Cheniere to place Train 2 in commercial service. Train 1 has already received FERC’s authorization for commercial service on May 3rd. This authorization allows Cheniere to begin receiving fixed payments for 20 years from Train 2 capacity holders whether or not they decide to take LNG. Several cargoes have already been exported from Train 2, prior to the start of scheduled maintenance on September 20. One vessel (LNG-carrying capacity 3.0 Bcf) left the terminal on October 9.
Storage:
Injections into storage remain below historical norms. Net injections into storage totaled 79 Bcf, compared with the five-year (2011–15) average net injection of 92 Bcf and last year's net injections of 97 Bcf during the same week. These net injections follow last week's net build of 80 Bcf. Two of the season's three largest net injections into storage occurred in the last two weeks. The 2016 refill season remains on pace to be the only refill season, aside from 2012, not to post a single week that exceeds 100 Bcf—a threshold that typically is exceeded at least two times during the refill season. Working gas stocks total 3,759 Bcf, which is 192 Bcf more than the five-year average and 56 Bcf more than last year at this time.
Working gas stocks remain poised to end the 2016 refill season at near record levels. If net injections match the five-year average for the remainder of the refill season, working gas stocks will total 3,998 Bcf on October 31. This storage level exceeds the all-time end of refill season high of 3,929 Bcf in 2012. In 2015, working gas stocks totaled 3,926 Bcf at the end of October, before reaching the highest reported level of 4,009 Bcf on November 20, 2015. However, net injections into storage are 35% lower than the five-year average pace so far in the refill season, At this slower than average rate, working gas stocks will total 3,915 Bcf at the end of the refill season.
South Central region posts largest net injection of 2016 refill season. Net injections totaled 31 Bcf in the South Central region, with salt dome facilities accounting for net injections of 16 Bcf. For the second week in a row, the total net injections at salt dome facilities in the region posted a new season high for the 2016 refill season, which exceeds the year-ago value of 14 Bcf for the report week. Working gas stocks in the South Central region are 8% higher than the five-year average for this time of year, while working gas stocks at salt dome facilities in the region are 11% below last year at this time.
Net injections fall below median market expectations, prices on the Nymex increase. Estimates of net injections into storage ranged from 79 Bcf to 98 Bcf, with a median of 87 Bcf. The price of the Nymex futures contract for November delivery at the Henry Hub rose about 12¢/MMBtu with relatively heavy trading (1,198 trades) at the release of EIA's Weekly Natural Gas Storage Report (WNGSR). Prices reached $3.29/MMBtu within two minutes of the release.
Spread to the January futures price remains close to year-ago levels. During the most recent storage week, the average natural gas spot price at the Henry Hub was $2.87/MMBtu, while the Nymex futures price of natural gas for delivery in January 2017 averaged $3.34/MMBtu, a difference of 47¢. The premium was 45¢ a year ago.
Temperatures remain higher than normal. Temperatures in the Lower 48 states averaged 66°F, 4°F higher than the normal and 6°F higher than last year at this time. Cooling degree days (CDD) in the Lower 48 states totaled 25, compared to 14 last year and compared to a normal of 20.
See also:
| Spot Prices ($/MMBtu) | Thu, 06-Oct |
Fri, 07-Oct |
Mon, 10-Oct |
Tue, 11-Oct |
Wed, 12-Oct |
|---|---|---|---|---|---|
| Henry Hub |
2.99 |
2.96 |
3.14 |
3.14 |
3.17 |
| New York |
1.02 |
1.00 |
1.33 |
1.07 |
1.04 |
| Chicago |
2.90 |
2.88 |
3.00 |
3.10 |
3.15 |
| Cal. Comp. Avg.* |
3.04 |
2.96 |
3.14 |
3.06 |
3.02 |
| Futures ($/MMBtu) | |||||
| November contract | 3.049
|
3.193
|
3.275
|
3.237
|
3.210
|
| December contract |
3.282 |
3.391 |
3.454 |
3.429 |
3.410 |
| *Avg. of NGI's reported prices for: Malin, PG&E Citygate, and Southern California Border Avg. | |||||
| Source: NGI's Daily Gas Price Index | |||||
| U.S. natural gas supply - Gas Week: (10/6/16 - 10/12/16) | |||
|---|---|---|---|
Average daily values (Bcf/d): |
|||
this week |
last week |
last year |
|
| Marketed production | 78.1
|
78.1
|
80.9
|
| Dry production | 70.2
|
70.2
|
72.7
|
| Net Canada imports | 6.1
|
6.1
|
5.4
|
| LNG pipeline deliveries | 0.3
|
0.3
|
0.2
|
| Total supply | 76.6
|
76.6
|
78.3
|
|
Source: OPIS PointLogic Energy, an IHS Company | |||
| U.S. natural gas consumption - Gas Week: (10/6/16 - 10/12/16) | |||
|---|---|---|---|
Average daily values (Bcf/d): |
|||
this week |
last week |
last year |
|
| U.S. consumption | 57.0
|
56.0
|
58.9
|
| Power | 25.8
|
25.3
|
25.8
|
| Industrial | 19.9
|
19.7
|
20.3
|
| Residential/commercial | 11.3
|
11.0
|
12.9
|
| Mexico exports | 3.3
|
3.2
|
3.2
|
| Pipeline fuel use/losses | 6.2
|
6.2
|
6.5
|
| LNG pipeline receipts | 0.0
|
0.0
|
0.0
|
| Total demand | 66.5
|
65.4
|
68.5
|
|
Source: OPIS PointLogic Energy, an IHS Company | |||
| Rigs | |||
|---|---|---|---|
Fri, October 07, 2016 |
Change from |
||
last week |
last year |
||
| Oil rigs | 428 |
0.7% |
-29.3% |
| Natural gas rigs | 94 |
-2.1% |
-50.3% |
| Miscellaneous | 2 |
100.0% |
100.0% |
| Rig numbers by type | |||
|---|---|---|---|
Fri, October 07, 2016 |
Change from |
||
last week |
last year |
||
| Vertical | 61 |
-4.7% |
-46.5% |
| Horizontal | 413 |
1.5% |
-30.9% |
| Directional | 50 |
-2.0% |
-39.8% |
| Source: Baker Hughes Inc. | |||
| Working gas in underground storage | ||||
|---|---|---|---|---|
Stocks billion cubic feet (Bcf) |
||||
| Region | 2016-10-07 |
2016-09-30 |
change |
|
| East | 913 |
899 |
14 |
|
| Midwest | 1,071 |
1,045 |
26 |
|
| Mountain | 240 |
237 |
3 |
|
| Pacific | 323 |
318 |
5 |
|
| South Central | 1,212 |
1,181 |
31 |
|
| Total | 3,759 |
3,680 |
79 |
|
| Source: U.S. Energy Information Administration | ||||
| Working gas in underground storage | |||||
|---|---|---|---|---|---|
Historical comparisons |
|||||
Year ago (10/7/15) |
5-year average (2011-2015) |
||||
| Region | Stocks (Bcf) |
% change |
Stocks (Bcf) |
% change |
|
| East | 875 |
4.3 |
881 |
3.6 |
|
| Midwest | 1,007 |
6.4 |
1,011 |
5.9 |
|
| Mountain | 209 |
14.8 |
201 |
19.4 |
|
| Pacific | 365 |
-11.5 |
350 |
-7.7 |
|
| South Central | 1,248 |
-2.9 |
1,124 |
7.8 |
|
| Total | 3,703 |
1.5 |
3,567 |
5.4 |
|
| Source: U.S. Energy Information Administration | |||||
| Temperature -- heating & cooling degree days (week ending Oct 06) | ||||||||
|---|---|---|---|---|---|---|---|---|
HDD deviation from: |
CDD deviation from: |
|||||||
| Region | HDD Current |
normal |
last year |
CDD Current |
normal |
last year |
||
| New England | 26
|
-45
|
-55
|
1
|
1
|
1
|
||
| Middle Atlantic | 26
|
-33
|
-47
|
0
|
-3
|
0
|
||
| E N Central | 20
|
-42
|
-45
|
9
|
5
|
9
|
||
| W N Central | 32
|
-29
|
-43
|
6
|
-1
|
6
|
||
| South Atlantic | 3
|
-25
|
-32
|
57
|
17
|
29
|
||
| E S Central | 7
|
-20
|
-18
|
40
|
16
|
23
|
||
| W S Central | 1
|
-5
|
-10
|
70
|
22
|
28
|
||
| Mountain | 49
|
-13
|
10
|
20
|
-3
|
-3
|
||
| Pacific | 21
|
1
|
10
|
6
|
-10
|
-5
|
||
| United States | 20
|
-24
|
-26
|
25
|
5
|
11
|
||
|
Note: HDD = heating degree day; CDD = cooling degree day Source: National Oceanic and Atmospheric Administration | ||||||||
Average temperature (°F)
7-Day Mean ending Oct 06, 2016
Source: NOAA National Weather Service
Deviation between average and normal (°F)
7-Day Mean ending Oct 06, 2016
Source: NOAA National Weather Service