In the News:
Gulf Coast’s first ethane shipment soon to leave for Europe
The first ethane shipment out of Enterprise Products Partners’ (EPP) new export terminal in Morgan’s Point, Texas, is preparing to set sail for Norway. As of Thursday morning, the JS INEOS Intrepid was docked at the terminal, preparing to take on its ethane cargo. The terminal, located on the Houston Ship Channel, is the second to open in the United States, and has an export capacity of up to 200,000 barrels of liquefied ethane per day, of which about 90% is contracted. The United States’ first ethane export terminal, at Marcus Hook, Pennsylvania, has been shipping ethane cargoes since March of this year.
Ethane can either be extracted along with other natural gas plant liquids (NGPL) and sold separately, or left in the processed gas and sold as part of the natural gas stream. Recent rapid growth in natural gas production from resources rich in NGPL has yielded higher quantities of ethane than the U.S. market can absorb, leading to growing amounts of ethane left in the processed gas stream. Increased ethane exports could slow or reverse this trend.
Natural gas produced in the Marcellus and Utica formations, located primarily in Pennsylvania and Ohio, respectively, tends to be rich in ethane. The Marcus Hook terminal sources all of its ethane from these formations. Some of this Appalachian ethane likely will be delivered to Morgan’s Point via EPP’s Appalachia-to-Texas Express (ATEX) pipeline, which moves ethane from gas fractionation plants in the Marcellus and Utica to the company’s storage complex in Mont Belvieu, Texas.
Ethane cargoes from the United States are used as feedstock in European ethylene crackers. Shipments currently go to the cracker in Rafnes, Norway, which is run by the petrochemical manufacturer INEOS. A cracker at Stenungsund in Sweden, owned by Borealis, is expected to begin receiving ethane from Marcus Hook later this year, while another INEOS cracker in Grangemouth, Scotland, is scheduled to come online in the fall and will receive ethane deliveries primarily from Morgan’s Point.
Overview:
(For the Week Ending Wednesday, August 24, 2016)
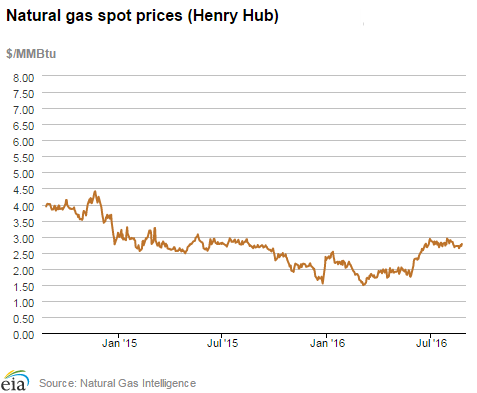
- Natural gas spot prices rose at most locations this report week (Wednesday, August 17, to Wednesday, August 24). The Henry Hub spot price rose from $2.71 per million British thermal units (MMBtu) last Wednesday to $2.77/MMBtu yesterday.
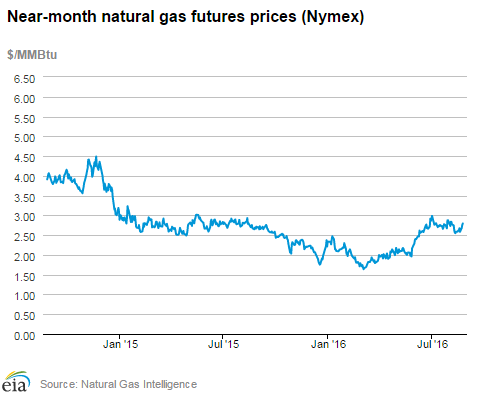
- At the New York Mercantile Exchange (Nymex), the September 2016 contract rose 18¢, from $2.619/MMBtu last Wednesday to $2.796/MMBtu yesterday.
- Net injections to working gas totaled 11 Bcf for the week ending August 19. Working gas stocks are 3,350 billion cubic feet (Bcf), which is 9% greater than the year-ago level and 12% greater than the five-year (2011-15) average for this week.
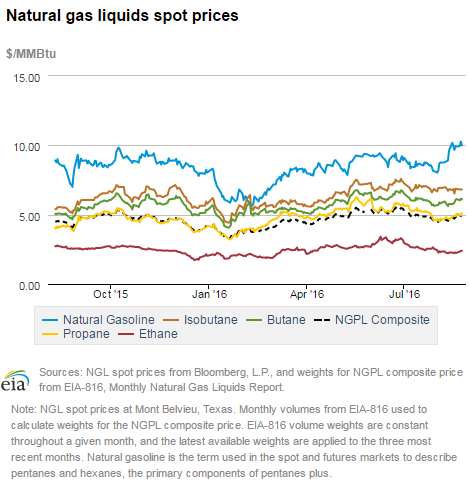
- The natural gas plant liquids composite price at Mont Belvieu, Texas, rose by 18¢, closing at $4.80/MMBtu for the week ending August 19. The price of ethane and isobutane both fell by 1%. The price of natural gasoline, propane, and butane rose by 9%, 5%, and 3%, respectively.
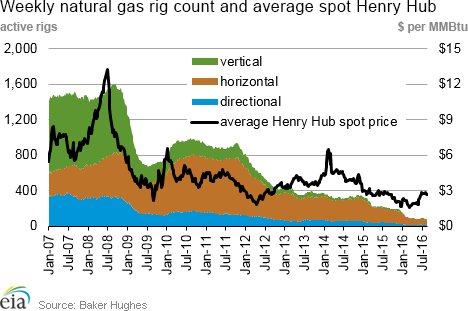
- According to Baker Hughes, for the week ending Friday, August 19, the natural gas rig count remained flat at 83. The number of oil-directed rigs rose by 10 to 406. The total rig count climbed by 10, and now stands at 491. This week marks the eighth consecutive weekly increase in the total rig count.
Prices/Supply/Demand:
Spot prices generally rise. This report week the Henry Hub spot price rose 6¢ from $2.71/MMBtu last Wednesday to $2.77/MMBtu yesterday. Price increases near the end of the report week may have been the result of forecasts for warmer weather in the coming days. At the Chicago Citygate, prices increased 10¢ from $2.66/MMBtu last Wednesday to $2.76/MMBtu yesterday. Similarly, prices at PG&E Citygate in California gained 10¢, going from $3.15/MMBtu last Wednesday to $3.25/MMBtu yesterday.
Northeast prices mixed. At the Algonquin Citygate, which serves Boston-area consumers, prices went up 5¢ from $2.84/MMBtu last Wednesday to $2.89/MMBtu yesterday. At the Transcontinental Pipeline’s Zone 6 trading point for New York, prices decreased 63¢ from $2.44/MMBtu last Wednesday to $1.81/MMBtu yesterday. New York prices dropped to a weekly low of $1.48/MMBtu Tuesday before rebounding yesterday.
Marcellus prices increase. Tennessee Zone 4 Marcellus spot prices advanced 14¢ from $1.20/MMBtu last Wednesday to $1.34/MMBtu yesterday. Prices at Dominion South in northwest Pennsylvania rose 8¢ from $1.28/MMBtu last Wednesday to $1.36/MMBtu yesterday.
Nymex prices rise. At the Nymex, the price of the September 2016 contract increased 18¢, from $2.619/MMBtu last Wednesday to $2.796/MMBtu yesterday. The price of the 12-month strip averaging September 2016 through August 2017 futures contracts climbed 9¢ to $3.050/MMBtu.
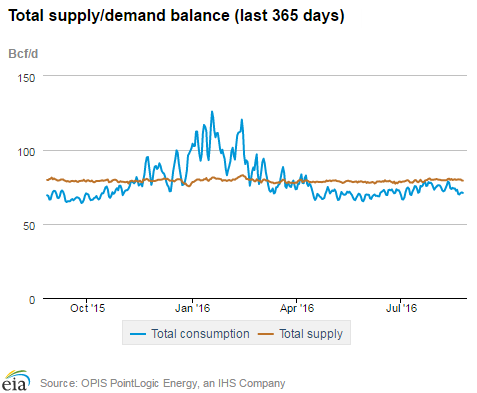
Supply flat. According to data from PointLogic, total supply of natural gas remained the same as last week, averaging 79.9 Bcf/d. Dry production grew by 1% over the report week, which PointLogic noted was driven by increases in the Appalachian production states of West Virginia, Pennsylvania, and Ohio. Average net imports from Canada decreased by 8% from last week.
Declines in power burn drive overall consumption declines. During the report week, total U.S. consumption of natural gas fell by 5%, according to data from PointLogic. Power burn declined by 12% week over week as temperatures remained warm but moderated from extreme heat. Industrial sector consumption stayed constant, averaging 19.4 Bcf/d. Natural gas exports to Mexico went up 4%.
U.S. liquefied natural gas (LNG) exports. The natural gas pipeline flows to Sabine Pass liquefaction terminal averaged 0.7 Bcf/d, 43% lower than flows last week. Three vessels departed the Sabine Pass terminal on August 18, 20, and 23 filled with 10 Bcf equivalent of LNG that was liquefied and stored at the terminal previously.
Storage:
Injections to storage continue at slower-than-normal rate. Net injections into storage totaled 11 Bcf, compared with the five-year (2011-15) average net injections of 66 Bcf and last year’s net injections of 63 Bcf during the same week. Working gas stocks total 3,350 Bcf, 350 Bcf above the five-year average and 275 Bcf above last year at this time.
This week marks the 16th consecutive week that the gap of working gas stocks compared with the five-year average declined. When the refill season began on April 1, working gas stocks were 874 Bcf above the five-year average.
The South Central region posts a net withdrawal for the sixth straight week. Net withdrawals totaled 14 Bcf in the South Central region, with salt dome facilities accounting for 13 Bcf of the total. This marks the first time that that working gas stocks in the South Central region declined in six successive weeks during the summer months. Withdrawals from storage are on a record-setting pace this year, with net withdrawals from storage in the South Central region occurring more frequently and at larger volumes than ever before. So far in the refill season (April 1-October 31), net withdrawals from storage in that region have occurred in eight different weeks, totaling 91 Bcf, compared with 2012 when net withdrawals totaled 36 Bcf in seven weeks. Nevertheless, working gas stocks in the South Central region remain 20% above the five-year average for this time of year.
Market expectations higher than actual net injections. Estimates of net injections into storage generally ranged from 12 to 28 Bcf, with a median of 18 Bcf. As a result, the price of the Nymex contract for September delivery at the Henry Hub rose 2¢/MMBtu to $2.85MMBtu, in 571 trades at the release of the Weekly Natural Gas Storage Report. Prices declined considerably in subsequent trading, falling to $2.81/MMBtu, within two minutes of the release.
Spread to the January futures price rises on the week. During the most recent storage week, the average natural gas spot price at the Henry Hub was $2.71/MMBtu, while the Nymex futures price of natural gas for delivery in January 2017 averaged $3.22/MMBtu, a difference of 51¢/MMBtu. A year ago, the premium was 36¢/MMBtu. The average Henry Hub price so far in the injection season this year, from April 1 to August 18, is $2.36/MMBtu, 14% lower than the average value of $2.76/MMBtu for the same period last year. Earlier during this year’s refill season, the premium exceeded $1/MMBtu.
Temperatures rise from week-ago levels, remain higher than normal. Temperatures in the Lower 48 states averaged 78°F, 4°F more than normal and 1°F more than last year at this time. Cooling degree-days (CDD) in the Lower 48 states totaled 94, compared with 82 last year and a normal of 68. Cumulative cooling degree-days since the beginning of the refill season are 22% above normal.
See also:
")
| Spot Prices ($/MMBtu) | Thu, 18-Aug |
Fri, 19-Aug |
Mon, 22-Aug |
Tue, 23-Aug |
Wed, 24-Aug |
|---|---|---|---|---|---|
| Henry Hub | 2.71 |
2.64 |
2.74 |
2.71 |
2.77 |
| New York | 2.01 |
1.55 |
1.56 |
1.48 |
1.81 |
| Chicago | 2.66 |
2.58 |
2.64 |
2.66 |
2.76 |
| Cal. Comp. Avg.* | 2.81 |
2.71 |
2.97 |
2.84 |
2.89 |
| Futures ($/MMBtu) | |||||
| September Contract | 2.674 |
2.584 |
2.679 |
2.761 |
2.796 |
| October Contract | 2.712 |
2.619 |
2.701 |
2.794 |
2.835 |
| *Avg. of NGI's reported prices for: Malin, PG&E Citygate, and Southern California Border Avg. | |||||
| Source: NGI's Daily Gas Price Index | |||||
| U.S. natural gas supply - Gas Week: (8/18/16 - 8/24/16) | |||
|---|---|---|---|
Average daily values (Bcf/d): |
|||
this week |
last week |
last year |
|
| Marketed production | 81.6
|
81.1
|
82.3
|
| Dry production | 73.4
|
73.0
|
74.0
|
| Net Canada imports | 6.3
|
6.8
|
5.8
|
| LNG pipeline deliveries | 0.2
|
0.2
|
0.2
|
| Total supply | 79.9
|
80.0
|
79.9
|
|
Source: OPIS PointLogic Energy, an IHS Company | |||
| U.S. natural gas consumption - Gas Week: (8/18/16 - 8/24/16) | |||
|---|---|---|---|
Average daily values (Bcf/d): |
|||
this week |
last week |
last year |
|
| U.S. consumption | 60.5
|
63.7
|
60.0
|
| Power | 33.5
|
37.9
|
31.5
|
| Industrial | 19.4
|
19.4
|
19.5
|
| Residential/commercial | 7.7
|
6.4
|
8.9
|
| Mexico exports | 3.7
|
3.6
|
3.3
|
| Pipeline fuel use/losses | 6.5
|
6.8
|
6.4
|
| LNG pipeline receipts | 0.7
|
1.2
|
0.0
|
| Total demand | 71.5
|
75.3
|
69.7
|
|
Source: OPIS PointLogic Energy, an IHS Company | |||
| Rigs | |||
|---|---|---|---|
Fri, August 19, 2016 |
Change from |
||
last week |
last year |
||
| Oil rigs | 406 |
2.5% |
-39.8% |
| Natural gas rigs | 83 |
0.0% |
-60.7% |
| Miscellaneous | 2 |
0.0% |
0.0% |
| Rig numbers by type | |||
|---|---|---|---|
Fri, August 19, 2016 |
Change from |
||
last week |
last year |
||
| Vertical | 64 |
3.2% |
-50.8% |
| Horizontal | 382 |
1.9% |
-43.6% |
| Directional | 45 |
2.3% |
-42.3% |
| Source: Baker Hughes Inc. | |||
| Working gas in underground storage | ||||
|---|---|---|---|---|
Stocks billion cubic feet (Bcf) |
||||
| Region | 2016-08-19 |
2016-08-12 |
change |
|
| East | 775 |
763 |
12 |
|
| Midwest | 875 |
861 |
14 |
|
| Mountain | 219 |
217 |
2 |
|
| Pacific | 310 |
313 |
-3 |
|
| South Central | 1,171 |
1,185 |
-14 |
|
| Total | 3,350 |
3,339 |
11 |
|
| Source: U.S. Energy Information Administration | ||||
| Working gas in underground storage | |||||
|---|---|---|---|---|---|
Historical comparisons |
|||||
Year ago (8/19/15) |
5-year average (2011-2015) |
||||
| Region | Stocks (Bcf) |
% change |
Stocks (Bcf) |
% change |
|
| East | 719 |
7.8 |
730 |
6.2 |
|
| Midwest | 761 |
15.0 |
789 |
10.9 |
|
| Mountain | 182 |
20.3 |
174 |
25.9 |
|
| Pacific | 345 |
-10.1 |
329 |
-5.8 |
|
| South Central | 1,068 |
9.6 |
978 |
19.7 |
|
| Total | 3,075 |
8.9 |
3,000 |
11.7 |
|
| Source: U.S. Energy Information Administration | |||||
| Temperature -- heating & cooling degree days (week ending Aug 18) | ||||||||
|---|---|---|---|---|---|---|---|---|
HDD deviation from: |
CDD deviation from: |
|||||||
| Region | HDD Current |
normal |
last year |
CDD Current |
normal |
last year |
||
| New England | 0
|
-3
|
0
|
83
|
49
|
21
|
||
| Middle Atlantic | 0
|
-3
|
-1
|
101
|
52
|
30
|
||
| E N Central | 0
|
-5
|
-1
|
72
|
26
|
8
|
||
| W N Central | 0
|
-5
|
-7
|
61
|
1
|
4
|
||
| South Atlantic | 0
|
0
|
0
|
124
|
34
|
29
|
||
| E S Central | 0
|
0
|
0
|
104
|
17
|
24
|
||
| W S Central | 0
|
0
|
0
|
109
|
-13
|
-18
|
||
| Mountain | 0
|
-6
|
-5
|
88
|
18
|
-4
|
||
| Pacific | 0
|
-4
|
-1
|
77
|
33
|
1
|
||
| United States | 0
|
-3
|
-1
|
94
|
26
|
12
|
||
|
Note: HDD = heating degree-day; CDD = cooling degree-day Source: National Oceanic and Atmospheric Administration | ||||||||
Average temperature (°F)
7-Day Mean ending Aug 18, 2016
Source: NOAA/National Weather Service
Deviation between average and normal (°F)
7-Day Mean ending Aug 18, 2016
Source: NOAA/National Weather Service
