In the News:
Gas pipeline exports to Mexico reduce U.S. net imports
Net imports of natural gas to the United States have declined substantially this year, averaging 2.2 billion cubic feet per day (Bcf/d) in April, up from a 30-year record low of 1.5 Bcf/d in March, according to EIA’s Natural Gas Monthly. Recent growth in pipeline exports to Mexico have resulted in the decline in U.S. net imports, and a new infrastructure expansion set to come online in Mexico today is expected to further increase U.S. natural gas exports to Mexico.
The Los Ramones pipeline flows gas sourced from the Eagle Ford Shale play in Texas into Mexico. The pipeline has come online in several phases, with Phase I and Phase II North entering service in 2014 and late 2015, respectively, extending from the U.S.—Mexico border 340 miles south to Villa Hidalgo. Phase II South, scheduled to begin service today, has a capacity of 1.4 Bcf/d and will move gas from Villa Hidalgo to the interconnect of the Tamazunchale pipeline, north of Mexico City.
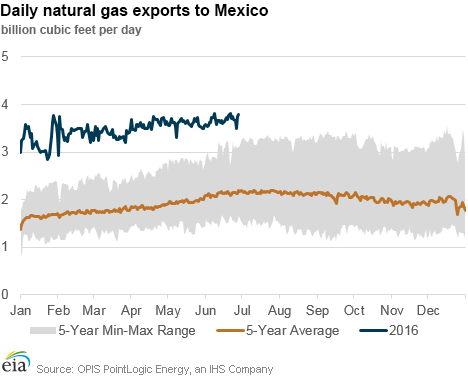
Midway through 2016, U.S. pipeline exports to Mexico have been increasing substantially. Daily PointLogic data show that year-to-date, pipeline exports to Mexico have averaged 3.5 Bcf/d, 37% above year ago levels and 89% above the five-year (2011–15) average level. Mexico’s growing use of natural gas in the power sector and flat-to-declining production have led Mexico to increase its pipeline imports. At the same time, the growth in power burn has been driven by the increased availability of low natural gas prices as a result of the infrastructure buildout.
In addition to increases in U.S. pipeline exports to Mexico, pipeline imports from Canada to the United States have declined over the past several years and LNG exports are beginning to ramp up as new liquefaction capacity comes online. EIA’s 2016 Annual Energy Outlook projects the United States will become a net exporter of natural gas in 2018, exporting 2.85 Bcf/d of natural gas. About half of all exports in 2018 are pipeline exports to Mexico, but later in the projection period LNG exports ramp up and exceed pipeline exports.
Overview:
(For the Week Ending Wednesday, June 29, 2016)
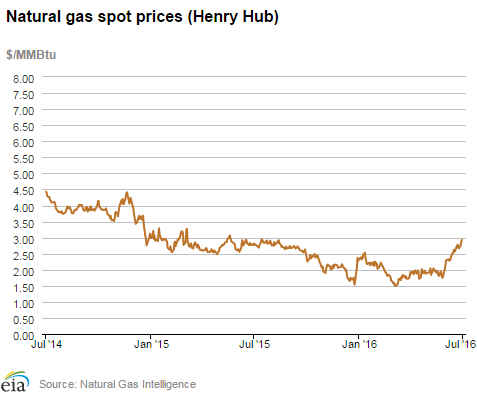
- Natural gas spot prices rose across most of the country this report week (Wednesday, June 22, to Wednesday, June 29). The Henry Hub spot price continued its upward climb, rising by 15¢ from $2.78 per million British thermal units (MMBtu) last Wednesday to $2.93/MMBtu yesterday.
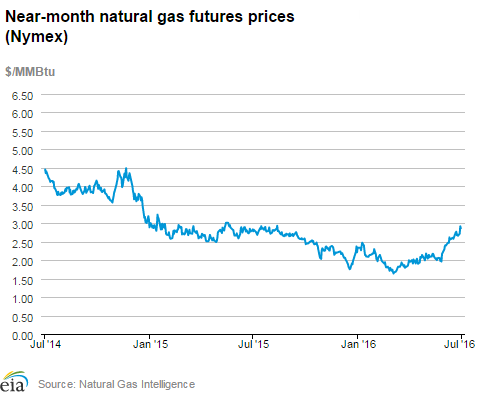
- At the New York Mercantile Exchange (Nymex), the July 2016 contract settled on Tuesday at $2.917/MMBtu, up 24¢ since last Wednesday. The August 2016 contract rose to $2.863/MMBtu yesterday, up 15¢ since last Wednesday.
- The implied net flow to working gas totaled 42 Bcf for the week ending June 24. Working gas stocks are 3,140 Bcf, which is 23% above the year-ago level and 25% above the five-year (2011-15) average for this week.
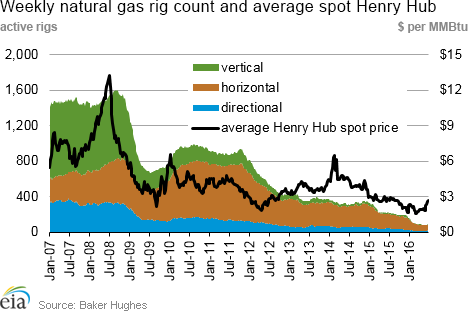
- According to Baker Hughes, for the week ending Friday, June 24, the natural gas rig count increased by 4 to 90, the largest weekly increase in natural gas rigs in nearly a year. Oil-directed rigs decreased by 7 to 330. The total rig count decreased by 3 over the week.
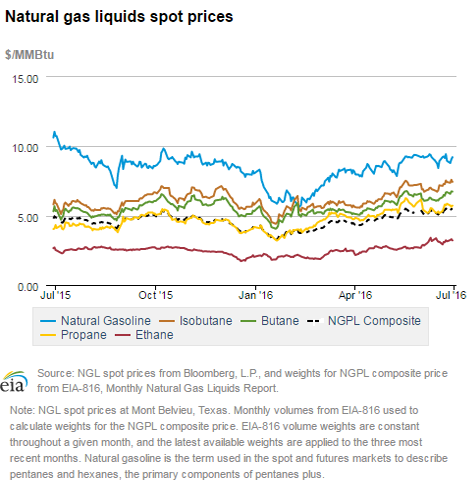
- The natural gas plant liquids composite price at Mont Belvieu, Texas, rose by 22¢, closing at $5.38/MMBtu for the week ending June 24. The price of ethane fell 4%, but the prices of all of the other natural gas liquids products rose. Propane rose by 8%; butane and isobutane both rose by 7%; and natural gasoline rose by 5%.
Prices/Supply/Demand:
Spot prices rise outside of Marcellus. The Henry Hub spot price continued its upward climb, rising by 15¢ from $2.78/MMBtu last Wednesday to $2.93/MMBtu yesterday. With its fifth consecutive week of increases, the Henry Hub price is at its highest level since August 2015. Prices around the country saw similar increases. At the Chicago Citygate, prices increased by 13¢ from last Wednesday and closed at $2.86/MMBtu yesterday.
Some analysts noted that the price increase early this week coincided with the shutting-in of Enterprise’s Pascagoula natural gas processing plant in Mississippi, which resulted from a fire. Pascagoula processes 400 million cubic feet per day (MMcf/d) of offshore gas. Its closure caused several offshore platforms to halt production.
California heat wave continues, pushing prices even higher. On the West Coast, hot summer temperatures lingered, increasing air conditioning load and electricity demand. Prices in the region rose again this week, and are now the highest in the nation. The PG&E Citygate price in California rose by 24¢ over the report week, from $3.02/MMBtu to $3.26/MMBtu yesterday. Similarly, at the SoCal Citygate, prices rose 29¢, to $3.28/MMBtu.
Northeast prices also increase on hot weather. Prices in major northeastern market areas also rose during the report period. At the Algonquin Citygate, which serves Boston-area consumers, prices rose 12¢ Wednesday to Wednesday, from $2.80/MMBtu to $2.92/MMBtu. At the Transcontinental Pipeline’s Zone 6 trading point for New York, prices rose 7¢, from $2.01/MMBtu last Wednesday to $2.08/MMBtu yesterday.
Marcellus prices fall. Unlike northeastern price points delivering to major population centers, prices in the Marcellus region fell this report period. The Tennessee Zone 4 Marcellus price fell 20¢, closing at $1.65/MMBtu yesterday. The price at Dominion South in northwest Pennsylvania fell by 12¢, ending the week at $1.79/MMBtu.
Nymex prices increase. At the Nymex, the July 2016 contract expired on Tuesday at $2.917/MMBtu, up 24¢ since last Wednesday. The August 2016 contract rose to $2.863/MMBtu yesterday, up 15¢ since last Wednesday. The 12-month strip averaging August 2016 through July 2017 futures contracts increased 9¢, to $3.095/MMBtu.
Price of crude oil falls on news of Brexit. When Great Britain voted last Thursday to leave the European Union, a decision referred to as the Brexit, stock prices around the globe fell, the British pound weakened, and the dollar strengthened, which may have applied downward pressure on crude oil prices. The Brent crude price fell to $46.69 per barrel (b) on Friday, June 24, and it continued to fall through Monday, June 27, to $45.07/b.
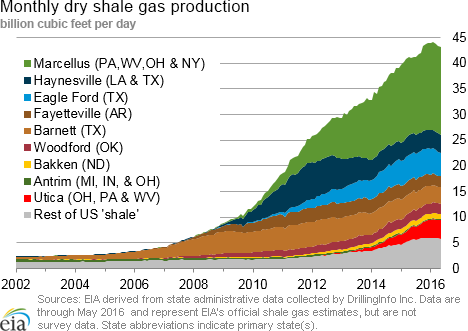
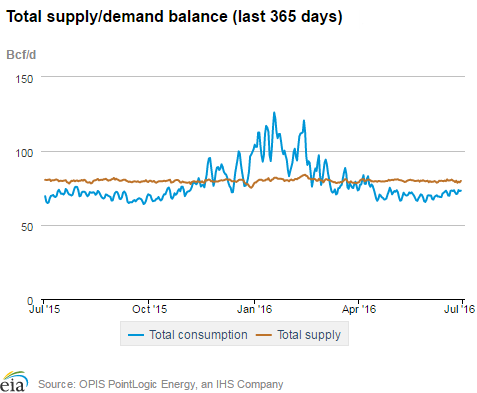
Production slightly down. According to data from PointLogic, total supply of natural gas fell by 1% over the report week, with dry production falling by 1%. Average net imports from Canada also fell, declining by 6%. LNG pipeline deliveries fell from last week, and remain a small contributor to overall supply.
Consumption slightly up. During the report week, total U.S. consumption of natural gas rose by 1% according to data from PointLogic. Power burn rose by 1% week over week. Industrial sector consumption remained the same as last week, averaging 19.6 Bcf/d. In the residential and commercial sectors, which generally consume less gas during the summer, consumption rose by 6%. Natural gas exports to Mexico were the same as last week, averaging 3.7 Bcf/d.
U.S. LNG exports. Natural gas pipeline flows to Sabine Pass averaged 0.4 Bcf/d, 28% lower than receipts last week. One vessel (LNG-carrying capacity 3.7 Bcf) departed Sabine Pass terminal on June 23 and one vessel (LNG-carrying capacity 3.0 Bcf) is currently loading at the terminal.
Storage:
EIA reports inventory adjustment. The implied net flow into storage totaled 42 Bcf during the storage report week, compared with the five-year (2011–15) average of 78 Bcf and last year’s net injection of 73 Bcf during the same week. EIA also reported in the Weekly Natural Gas Storage Report a non-flow-related adjustment that lowered working gas by five Bcf for the week ending June 24. Inventory adjustments may occur because of reclassifications between working and base gas, operational balancing agreements, or engineering assessments of natural gas in a storage facility. The difference between the current surplus in storage compared with the five-year average declined from the previous week to 637 Bcf, and the surplus compared with year-ago levels decreased to 582 Bcf. The year-over-year storage surplus fell for the 12th consecutive week.
The January futures price continues to trade at premium over the current spot price. During the most recent storage week, the average natural gas spot price at the Henry Hub was $2.71/MMBtu, while the Nymex futures price of natural gas for delivery in January 2017 averaged $3.32/MMBtu, a difference of 61¢/MMBtu. A year ago, the premium was 47¢/MMBtu. The average Henry Hub price so far in the injection season this year, from April 1 to June 24, was $2.08/MMBtu, 24% lower than the average value of $2.72/MMBtu for the same period last year.
Stock change is within the range of analyst expectations. Expected net injections for the week ranged from 37 to 54 Bcf. Prices for the Nymex futures contract for August delivery at the Henry Hub rose about 4¢/MMBtu to $2.94/MMBtu, with 452 contracts traded at the release. Prices declined somewhat in subsequent trading, reaching $2.92/MMBtu within two minutes of EIA’s Weekly Natural Gas Storage Report release.
Rising temperatures boost cooling demand for natural gas. Temperatures in the Lower 48 states averaged 75°F during the storage report week, climbing 3% from the previous week. Temperatures during the report week were above normal throughout the Lower 48 states, on average by 4%, and were 1% below last year at this time. This week marked the fourth week in a row that cooling degree-days in the Lower 48 states exceeded the normal level. Cooling degree-days in the Lower 48 states since the beginning of the refill season on April 1 were 20% above normal.
See also:

| Spot Prices ($/MMBtu) | Thu, 23-Jun |
Fri, 24-Jun |
Mon, 27-Jun |
Tue, 28-Jun |
Wed, 29-Jun |
|---|---|---|---|---|---|
| Henry Hub | 2.68 |
2.67 |
2.76 |
2.86 |
2.93 |
| New York | 1.99 |
1.88 |
2.29 |
2.34 |
2.08 |
| Chicago | 2.62 |
2.60 |
2.70 |
2.80 |
2.86 |
| Cal. Comp. Avg.* | 2.65 |
2.65 |
2.90 |
2.97 |
3.06 |
| Futures ($/MMBtu) | |||||
| July Contract | 2.698 |
2.662 |
2.716 |
2.917 |
Expired |
| August Contract | 2.737 |
2.694 |
2.741 |
2.890 |
2.863 |
| September Contract | 2.744 |
2.702 |
2.744 |
2.888 |
2.858 |
| *Avg. of NGI's reported prices for: Malin, PG&E Citygate, and Southern California Border Avg. | |||||
| Source: NGI's Daily Gas Price Index | |||||
| U.S. natural gas supply - Gas week: (6/23/16 - 6/29/16) | |||
|---|---|---|---|
Average daily values (Bcf/d): |
|||
this week |
last week |
last year |
|
| Marketed production | 80.0 |
80.7 |
81.5 |
| Dry production | 72.5 |
73.1 |
73.5 |
| Net Canada imports | 6.5 |
6.9 |
6.0 |
| LNG pipeline deliveries | 0.2 |
0.2 |
0.2 |
| Total supply | 79.3 |
80.2 |
79.8 |
|
Source: OPIS PointLogic Energy, an IHS Company | |||
| U.S. natural gas consumption - Gas week: (6/23/16 - 6/29/16) | |||
|---|---|---|---|
Average daily values (Bcf/d): |
|||
this week |
last week |
last year |
|
| U.S. consumption | 61.5 |
60.9 |
60.3 |
| Power | 34.0 |
33.8 |
31.3 |
| Industrial | 19.6 |
19.6 |
19.5 |
| Residential/commercial | 7.9 |
7.5 |
9.5 |
| Mexico exports | 3.7 |
3.7 |
3.1 |
| Pipeloss fuel use/losses | 6.8 |
6.7 |
6.7 |
| LNG pipeline receipts | 0.4 |
0.6 |
- |
| Total demand | 72.5 |
72.0 |
70.1 |
|
Source: OPIS PointLogic Energy, an IHS Company | |||
| Rigs | |||
|---|---|---|---|
Fri, June 24, 2016 |
Change from |
||
last week |
last year |
||
| Oil rigs | 330 |
-2.1% |
-47.5% |
| Natural gas rigs | 90 |
4.7% |
-60.5% |
| Miscellaneous | 1 |
0.0% |
-66.7% |
| Rig numbers by type | |||
|---|---|---|---|
Fri, June 24, 2016 |
Change from |
||
last week |
last year |
||
| Vertical | 53 |
0.0% |
-50.5% |
| Horizontal | 325 |
-0.3% |
-50.3% |
| Directional | 43 |
-4.4% |
-56.1% |
| Source: Baker Hughes Inc. | |||
| Working gas in underground storage | ||||
|---|---|---|---|---|
Stocks billion cubic feet (bcf) |
||||
| Region | 2016-06-24 |
2016-06-17 |
change |
|
| East | 632 |
612 |
20 |
|
| Midwest | 742 |
724 |
18 |
|
| Mountain | 198 |
194 |
4 |
|
| Pacific | 315 C |
318 |
-3 |
|
| South Central | 1,253 |
1,255 |
-2 |
|
| Total | 3,140 C |
3,103 |
37 |
|
|
C=Reclassification. Source: U.S. Energy Information Administration | ||||
| Working gas in underground storage | |||||
|---|---|---|---|---|---|
Historical comparisons |
|||||
Year ago (6/24/15) |
5-year average (2011-2015) |
||||
| Region | Stocks (Bcf) |
% change |
Stocks (Bcf) |
% change |
|
| East | 544 |
16.2 |
569 |
11.1 |
|
| Midwest | 538 |
37.9 |
575 |
29.0 |
|
| Mountain | 154 |
28.6 |
144 |
37.5 |
|
| Pacific | 333 |
-5.4 |
297 |
6.1 |
|
| South Central | 990 |
26.6 |
918 |
36.5 |
|
| Total | 2,558 |
22.8 |
2,503 |
25.4 |
|
| Source: U.S. Energy Information Administration | |||||
| Temperature -- heating & cooling degree days (week ending Jun 23) | ||||||||
|---|---|---|---|---|---|---|---|---|
HDD deviation from: |
CDD deviation from: |
|||||||
| Region | HDD Current |
normal |
last year |
CDD Current |
normal |
last year |
||
| New England | 5
|
-3
|
-2
|
18
|
0
|
-10
|
||
| Middle Atlantic | 0
|
-4
|
0
|
45
|
13
|
-4
|
||
| E N Central | 1
|
-5
|
-4
|
58
|
20
|
17
|
||
| W N Central | 0
|
-7
|
-3
|
80
|
30
|
21
|
||
| South Atlantic | 0
|
0
|
0
|
85
|
5
|
-33
|
||
| E S Central | 0
|
0
|
0
|
95
|
20
|
-16
|
||
| W S Central | 0
|
0
|
0
|
128
|
21
|
11
|
||
| Mountain | 2
|
-15
|
2
|
87
|
27
|
0
|
||
| Pacific | 6
|
-6
|
5
|
48
|
22
|
-2
|
||
| United States | 2
|
-5
|
0
|
71
|
16
|
-3
|
||
|
Note: HDD = heating degree-day; CDD = cooling degree-day Source: National Oceanic and Atmospheric Administration | ||||||||
Average temperature (°F)
7-Day Mean ending Jun 23, 2016
Source: NOAA/National Weather Service
Deviation between average and normal (°F)
7-Day Mean ending Jun 23, 2016
Source: NOAA/National Weather Service