In the News:
Explosion on Texas Eastern Pipeline in Pennsylvania cuts flows
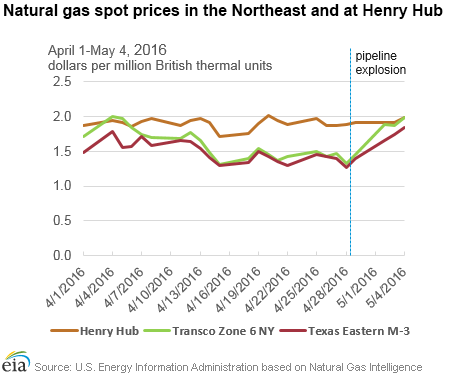
On April 29, an explosion and fire occurred on Spectra Energy's Texas Eastern Transmission (Tetco) 30-inch natural gas pipeline in southwestern Pennsylvania. The explosion happened in Westmoreland county, 40 miles east of Pittsburgh, according to the company's website. One person was severely injured and several homes and a storage injection well in the area were damaged. The portion of the pipeline involved in the incident was built in 1981 and inspected in 2012 without any identifiable problems requiring repair or remediation, according to Spectra Energy. The damaged segment runs through the Marcellus and Utica shale regions to New Jersey, where it connects with other pipelines, including Algonquin, which moves natural gas to New York and New England markets. The cause of the explosion is under investigation, and the time to complete the repair work remains unknown.
The company declared a force majeure downstream of the nearby Delmont compressor station and cut flows to zero from Delmont to the Perulack compressor station, which is located about 130 miles due east. The Delmont compressor has a capacity of 2.6 billion cubic feet per day (Bcf/d); however, the flows through the compressor averaged 1.4 Bcf/d in the preceding 30 days, according to Platts Bentek. Tetco is using withdrawals from Leidy Storage, which enter at Perulack, as well as additional flows on a parallel southern line, to compensate for reduced volumes on the damaged pipeline. In addition, pipelines to the north, such as Tennessee Gas Pipeline and Millennium, have taken on additional volumes to supply Algonquin and compensate for the lost flow.
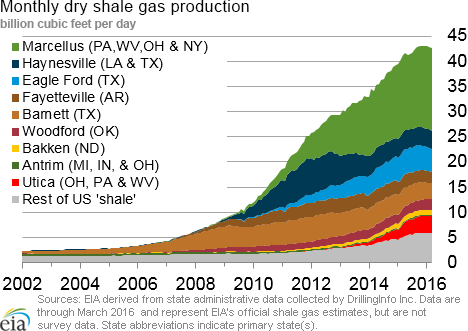
West of the Delmont compressor, Tetco issued a high-pressure operational flow order on its M-2 30-inch-diameter line, which carries production from Marcellus and Utica shales in Pennsylvania, Ohio, and West Virginia to northeastern markets. Additionally, there has been a noticeable increase in injections at the Oakford storage field, located upstream of the Delmont compressor, according to Platts Bentek. Overall, there is minimal impact on the production volumes in Marcellus and Utica, as pipeline systems in the affected area have sufficient flexibility to use alternative routes to carry shale production to markets.
Since the incident, prices at Tetco M-3 trading hub, which serves customers in the Mid-Atlantic region and is downstream of the explosion, increased by 58¢ per million British thermal units (MMBtu), from $1.27/MMBtu on Thursday to $1.85/MMBtu yesterday, trading as high as $3.25/MMBtu midday on Friday, possibly reflecting concerns about flow constraints in the region. Prices at Transco Zone 6 New York trading hub also increased following the explosion, by 66¢/MMBtu Thursday to Wednesday.
Overview:
(For the Week Ending Wednesday, May 4, 2016)
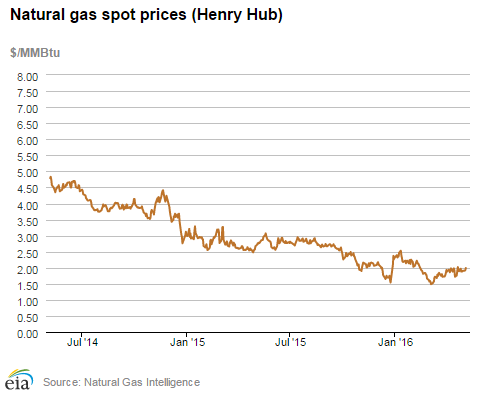
- Natural gas spot prices rose at most locations this report week (Wednesday, April 27, to Wednesday, May 4), with some exceptions in the Northeast. The Henry Hub spot price rose from $1.88/MMBtu last Wednesday to $1.99/MMBtu yesterday.
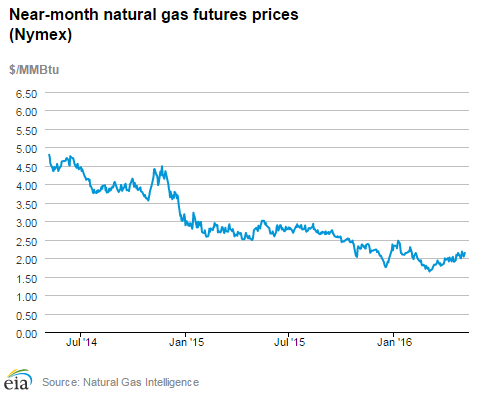
- At the New York Mercantile Exchange (Nymex), the June 2016 contract price declined slightly over the report week, from $2.153/MMBtu last Wednesday to $2.141/MMBtu yesterday.
- Net injections to working gas totaled 68 billion cubic feet (Bcf) for the week ending April 29. Working gas stocks are 2,625 Bcf, which is 49% above the year-ago level and 47% above the five-year (2011-15) average for this week.
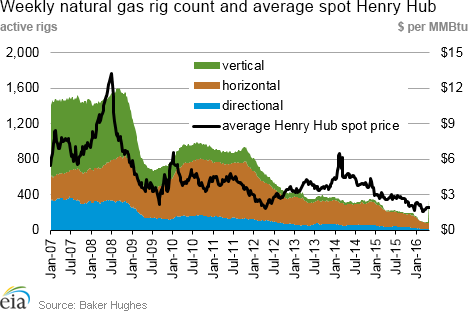
- According to Baker Hughes data, for the week ending April 29, the natural gas rig count fell by 1 to 87, and oil-directed rigs fell by 11 to 332. One miscellaneous rig was added during the week. The total rig count fell by 11, and now stands at 420.
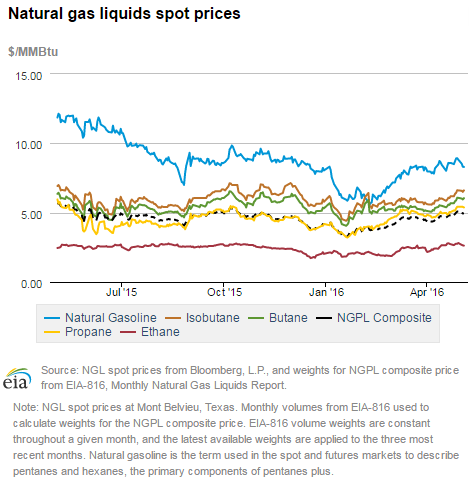
- The natural gas plant liquids (NGPL) composite price at Mont Belvieu, Texas, rose by 4.8% to $4.98/MMBtu for the week ending Friday, April 29. Natural gasoline, butane, propane, and isobutane all increased, rising by 4.2%, 6.8%, 6.7%, and 6.9%, respectively. The price of ethane remained flat.
Prices/Supply/Demand:
Henry Hub spot prices rise. The Henry Hub spot price rose 11¢ this week, rising from $1.88/MMBtu last Wednesday to $1.99/MMBtu yesterday. Price points at most other locations outside of the Northeast also rose this week. At the Chicago Citygate, prices rose to $2.09/MMBtu from $1.93. At the PG&E Citygate in California, the spot price rose from $2.03/MMBtu last Wednesday to $2.13/MMBtu yesterday.
Northeast prices mixed. At the Algonquin Citygate, which serves Boston-area consumers, prices fell 7¢ this week, beginning at $2.90/MMBtu last Wednesday, and ending the report week at $2.83/MMBtu yesterday. Although Algonquin prices are low, the Algonquin pipeline system has been undergoing maintenance, and flows remain constrained along various points. For most of March, Algonquin prices traded below the Henry Hub spot price, but since the beginning of April, Algonquin prices have been at a premium to the national benchmark. On the other hand, prices at Transcontinental Pipeline's Zone 6 trading point for New York rose from $1.47/MMBtu last Wednesday to $1.99/MMBtu yesterday, driven in part by disruptions on Tetco.
Marcellus prices increase slightly. The Tennessee Zone 4 Marcellus price rose from $1.33/MMBtu last Wednesday to $1.41/MMBtu yesterday. The price at Dominion South in northwest Pennsylvania was essentially flat, moving from $1.37/MMBtu to $1.42/MMBtu week over week.
Nymex prices fall slightly. At the New York Mercantile Exchange (Nymex), the June 2016 contract price fell slightly over the report week, from $2.153/MMBtu last Wednesday to $2.141/MMBtu yesterday. Despite the week-over-week decline, on Friday, the June contract settled at $2.178/MMBtu, the highest price of a near-month contract since January. This report week, the 12-month strip, averaging June 2016 through May 2017 contracts, fell from $2.728/MMBtu last Wednesday to $2.709/MMBtu.
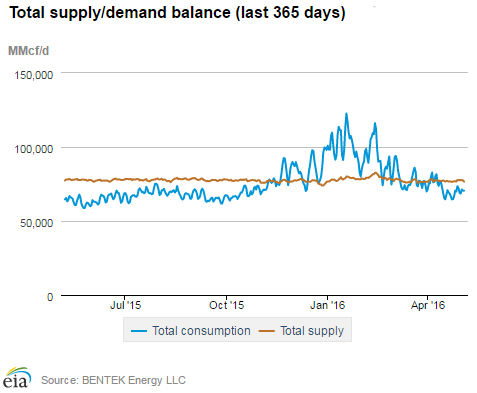
Supply rises. Total supply rose by 0.7% for the report period, driven by a 0.3% week-over-week increase in dry production, according to data from Bentek Energy. Imports from Canada increased by 7.9% this week, with increases occurring in every region. The sendout from LNG import terminals decreased, and remains a minor contributor to overall supply.
Consumption rises. Overall consumption this week rose by 4.6%, with increases in all major sectors. Residential and commercial consumption rose by 12.2%, the result of somewhat cooler temperatures this week in the Northeast and Midwest. Consumption of natural gas for power generation rose by 3.9%, while industrial consumption rose by 0.7%. Exports to Mexico rose by 1.8%.
Storage:
Working gas stocks continue upward climb. Working gas in the Lower 48 states posted its third straight week of net injections. Net injections into storage totaled 68 Bcf during the storage report week, compared with the five-year (2011-15) average of 64 Bcf and last year's net injection of 77 Bcf during the same week. As a result, the surplus in storage compared with the five-year average rose from the previous week to 836 Bcf, and the surplus compared with year-ago levels decreased to 861 Bcf.
The 2016 refill season remains well behind the pace of previous injection seasons. Cumulative net injections into working gas total 145 Bcf thus far in the 2016 refill season, compared with the five-year average (2011-15) of 183 Bcf and last year's tally of 292 Bcf during the same period. Despite the slow start to the refill season, working gas stocks remain near record-highs for this time of year. Working gas stocks as of last Friday were 40 Bcf above the previous five-year (2011-15) maximum for this time of year, which occurred in 2012. This surplus compared with the 2012 record level gained 38 Bcf during the week ending April 29.
January futures price continues to trade at more than $1 above current spot price. Decisions about whether to inject gas into storage during the refill season are often made with an eye toward the upcoming January, because it is typically the coldest winter month. During the most recent storage week, the average natural gas spot price at the Henry Hub was $1.90/MMBtu, while the Nymex futures price of natural gas for delivery in January 2017 averaged $3.04/MMBtu, a difference of $1.14/MMBtu. A year ago, the premium was 47¢/MMBtu, suggesting there is more financial incentive this year to buy and store natural gas in the summer for sale in the winter. The average Henry Hub price so far in the injection season this year, from April 1 to April 29, was $1.90/MMBtu, 26% lower than the average value of $2.60/MMBtu for the same period last year.
Stock change is within the range of analyst expectations. Expected net injections for the week generally ranged from 58 to 81 Bcf, with a median of 67 Bcf. At the release of the Weekly Natural Gas Storage Report, the price for the natural gas futures contract on the Nymex for June delivery at the Henry Hub rose 1¢/MMBtu to $2.12/MMBtu, with 192 trades executed at the release.
Temperatures close to seasonal norms in most of the Lower 48 states. Temperatures in the Lower 48 states averaged 58°F during the storage report week, 3% above normal and 8% above last year at this time. Only the Pacific U.S. Census Division reported temperatures that were below normal, by 4%. The West South Central Division reported the warmest temperatures in the Lower 48 states, averaging 71°F during the storage week.
See also:

| Spot Prices ($/MMBtu) | Thu, 28-Apr |
Fri, 29-Apr |
Mon, 02-May |
Tue, 03-May |
Wed, 04-May |
|---|---|---|---|---|---|
| Henry Hub |
1.80 |
1.80 |
1.85 |
1.96 |
1.99 |
| New York |
1.98 |
1.99 |
2.02 |
2.06 |
2.13 |
| Chicago |
1.76 |
1.75 |
1.80 |
1.91 |
1.96 |
| Cal. Comp. Avg.* |
1.85 |
1.85 |
1.89 |
1.98 |
2.03 |
| Futures ($/MMBtu) | |||||
| June contract | 2.078
|
2.178
|
2.042
|
2.086
|
2.141
|
| July contract |
2.253 |
2.322 |
2.218 |
2.254 |
2.296 |
| *Avg. of NGI's reported prices for: Malin, PG&E Citygate, and Southern California Border Avg. | |||||
| Source: NGI's Daily Gas Price Index | |||||
| U.S. natural gas supply - Gas Week: (4/27/16 - 5/4/16) | ||
|---|---|---|
Percent change for week compared with: |
||
last year |
last week |
|
| Gross production | -1.8%
|
0.3%
|
| Dry production | -1.8%
|
0.3%
|
| Canadian imports | 19.5%
|
7.9%
|
| West (net) | 12.3%
|
3.9%
|
| Midwest (net) | 5.6%
|
1.5%
|
| Northeast (net) | 218.4%
|
1642.9%
|
| LNG imports | 169.3%
|
-40.8%
|
| Total supply | -0.3%
|
0.7%
|
| Source: BENTEK Energy LLC | ||
| U.S. consumption - Gas Week: (4/27/16 - 5/4/16) | ||
|---|---|---|
Percent change for week compared with: |
||
last year |
last week |
|
| U.S. consumption | 8.7%
|
4.8%
|
| Power | 7.8%
|
3.9%
|
| Industrial | 0.4%
|
0.7%
|
| Residential/commercial | 19.5%
|
12.2%
|
| Total demand | 9.8%
|
4.6%
|
| Source: BENTEK Energy LLC | ||
| Rigs | |||
|---|---|---|---|
Fri, April 29, 2016 |
Change from |
||
last week |
last year |
||
| Oil rigs | 332 |
-3.21% |
-51.10% |
| Natural gas rigs | 87 |
-1.14% |
-60.81% |
| Miscellaneous | 1 |
0.00% |
-75.00% |
| Rig numbers by type | |||
|---|---|---|---|
Fri, April 29, 2016 |
Change from |
||
last week |
last year |
||
| Vertical | 50 |
-1.96% |
-55.75% |
| Horizontal | 324 |
-2.41% |
-53.65% |
| Directional | 46 |
-4.17% |
-50.54% |
| Source: Baker Hughes Inc. | |||
| Working gas in underground storage | ||||
|---|---|---|---|---|
Stocks billion cubic feet (bcf) |
||||
| Region | 2016-04-29 |
2016-04-22 |
change |
|
| East | 454 |
431 |
23 |
|
| Midwest | 566 |
554 |
12 |
|
| Mountain | 157 |
155 |
2 |
|
| Pacific | 284 |
277 |
7 |
|
| South Central | 1,164 |
1,140 |
24 |
|
| Total | 2,625 |
2,557 |
68 |
|
| Source: U.S. Energy Information Administration | ||||
| Working gas in underground storage | |||||
|---|---|---|---|---|---|
Historical comparisons |
|||||
Year ago (4/29/15) |
5-year average (2011-2015) |
||||
| Region | Stocks (Bcf) |
% change |
Stocks (Bcf) |
% change |
|
| East | 305 |
48.9 |
351 |
29.3 |
|
| Midwest | 307 |
84.4 |
364 |
55.5 |
|
| Mountain | 119 |
31.9 |
113 |
38.9 |
|
| Pacific | 285 |
-0.4 |
226 |
25.7 |
|
| South Central | 747 |
55.8 |
735 |
58.4 |
|
| Total | 1,764 |
48.8 |
1,789 |
46.7 |
|
| Source: U.S. Energy Information Administration | |||||
| Temperature -- heating & cooling degree days (week ending Apr 28) | ||||||||
|---|---|---|---|---|---|---|---|---|
HDD deviation from: |
CDD deviation from: |
|||||||
| Region | HDD Current |
normal |
last year |
CDD Current |
normal |
last year |
||
| New England | 100
|
-9
|
-26
|
0
|
0
|
0
|
||
| Middle Atlantic | 75
|
-17
|
-46
|
0
|
0
|
0
|
||
| E N Central | 81
|
-15
|
-55
|
1
|
0
|
1
|
||
| W N Central | 74
|
-12
|
-25
|
3
|
0
|
3
|
||
| South Atlantic | 19
|
-22
|
-47
|
34
|
13
|
4
|
||
| E S Central | 11
|
-26
|
-45
|
23
|
15
|
18
|
||
| W S Central | 6
|
-7
|
-11
|
45
|
16
|
8
|
||
| Mountain | 88
|
-7
|
-3
|
8
|
-3
|
3
|
||
| Pacific | 66
|
11
|
23
|
0
|
-4
|
-4
|
||
| United States | 61
|
-10
|
-27
|
13
|
3
|
3
|
||
|
Note: HDD = heating degree-day; CDD = cooling degree-day Source: National Oceanic and Atmospheric Administration | ||||||||
Average temperature (°F)
7-Day Mean ending Apr 28, 2016
Source: NOAA/National Weather Service
Deviation between average and normal (°F)
7-Day Mean ending Apr 28, 2016
Source: NOAA/National Weather Service