In the News:
Rig count at historic low, but gas production still high
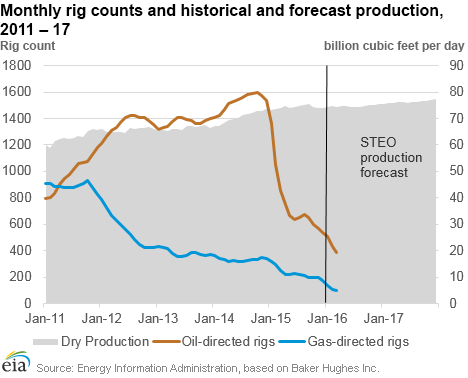
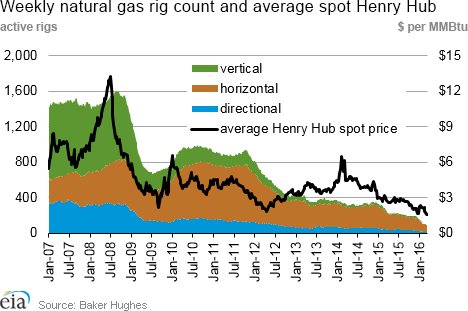
There were 94 active natural gas-directed rigs as of March 11, 2016, according to Baker Hughes Inc. data. This represents a decline of 3 units from last week, when rigs fell below 100 for the first time in Baker Hughes’s 29-year rig data history. Natural gas-directed rigs are currently 63% below their year-ago level and 89% below their level five years ago.
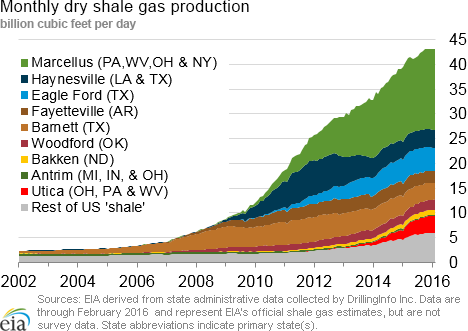
While rigs have declined dramatically in the past several years, production has grown steadily, indicating that drilling has become more efficient. Production data have only recently begun to show some signs of flattening after hitting a record high in September 2015.
While dry production grew 5.4% from 2014 to 2015, EIA’s Short-Term Energy Outlook projects that growth will flatten to 0.9% in 2016 with declining rig counts and sustained low prices. For 2017, EIA forecasts production to grow 2.1% year-over-year as prices rise somewhat. EIA expects production in the later part of 2016 and 2017 will pick up, particularly as new pipeline projects come online in the Marcellus and Utica shales.
Overview:
(For the Week Ending Wednesday, March 16, 2016)
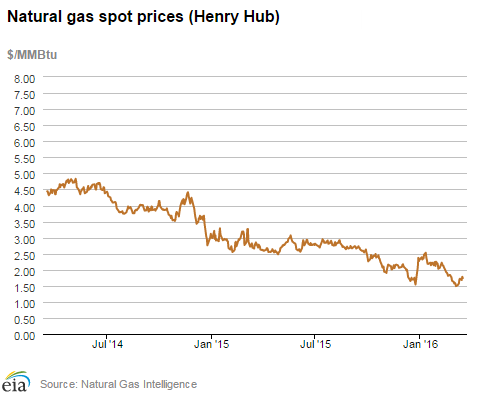
- Natural gas spot prices increased at virtually all spot market locations this report week (Wednesday, March 9, to Wednesday, March 16). The Henry Hub spot price rose during the report week from $1.57 per million British thermal unit (MMBtu) to $1.74 yesterday.
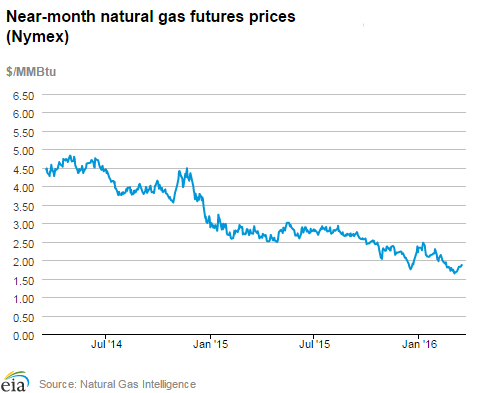
- At the New York Mercantile Exchange (Nymex), the price of the near-month (April 2016) contract rose from $1.752/MMBtu last Wednesday to $1.868/MMBtu yesterday.
- Net withdrawals from storage totaled 1 billion cubic feet (Bcf) for the week ending March 11. Working gas stocks are 2,478 Bcf -- 67.4% and 48.3% above the year-ago and five-year (2011-15) average levels, respectively.
- The Baker Hughes rotary rig count fell for the twelfth week in a row. For the week ending March 11, gas-directed rigs decreased by 3 to 94, and oil-directed rigs decreased by 6 to 386. The total rig count fell by a total of 9, and now stands at 480.
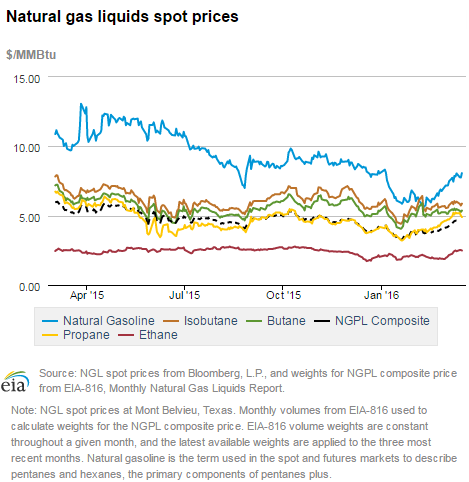
- The natural gas plant liquids (NGPL) composite price at Mont Belvieu, Texas, increased by 41¢ to $4.58/MMBtu for the week ending Friday, March 11. The spot prices of all natural gas liquids at Mont Belvieu increased this week, with ethane rising by 19.1%, propane rising by 9.6%, butane rising by 4.4%, isobutane rising by 5.9%, and natural gasoline rising by 7.7%. These increases likely stem from the recent rise in the price of crude oil.
Prices/Demand/Supply:
National prices increase but remain relatively low. The national benchmark Henry Hub spot price in southern Louisiana increased 17¢ this report period, closing at $1.74/MMBtu yesterday. In the Midwest, the Chicago Citygate price rose 10¢ week-over-week, closing at $1.87/MMBtu yesterday. On the West Coast, the SoCal Citygate price also rose 10¢ for the period, settling at $1.76/MMBtu yesterday.
Despite gains, Northeast prices also remain low. Prices serving major market locations in the Northeast rose from near-historic lows last week, but are trading at a discount to Henry Hub. At the Algonquin Citygate, which serves Boston-area consumers, prices rose from $1.08/MMBtu last Wednesday to $1.47/MMBtu yesterday. At Transco Zone 6 New York, serving New York City customers, prices rose from $1.00/MMBtu last Wednesday to $1.18/MMBtu yesterday.
Marcellus prices increase to more than $1.00. At Dominion South in northwest Pennsylvania, prices began at 87¢/MMBtu last Wednesday and ended the report week at $1.10/MMBtu yesterday. On Transco’s Leidy Line in northern Pennsylvania, the price followed a similar pattern, rising from 85¢ last Wednesday to $1.08/MMBtu yesterday.
Nymex prices increase. Prices in the futures market increased in the report week. The April 2016 near-month contract rose from $1.752/MMBtu last Wednesday to $1.868/MMBtu yesterday. The price of the 12-month strip (the average price of the 12 contracts between April 2016 and March 2017) rose from $2.240/MMBtu last Wednesday to $2.361/MMBtu yesterday.
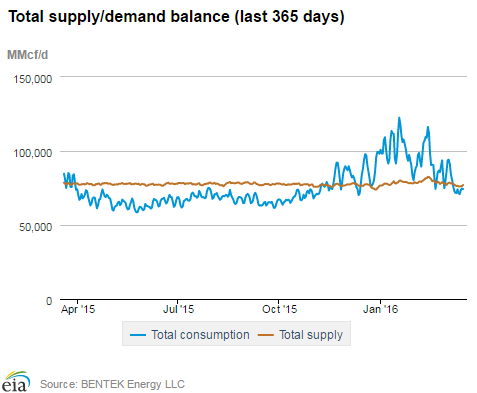
Supply declines. According to data from Bentek Energy, total supply fell by 1.9%, driven by a 1.5% decline in dry production. Although pipeline imports from Canada fell overall this week, there was regional variation. Imports from Canada increased in both the West and Midwest, but the Northeast drove the national decline. Every day this week, the Northeast was a net exporter to Canada, sending about 0.5 Bcf/d across the border late last week, and about 0.1 Bcf yesterday. The smaller export volume yesterday is likely related to lower temperatures in the region.
Warmer weather leads to declines in consumption. Overall consumption this week fell by 10.7%, driven by a decline in residential and commercial consumption, which fell by 26.0%. Industrial sector consumption fell 3.5%, consumption of natural gas for power generation fell 2.1%, and pipeline exports to Mexico rose 3.0%.
Authorization for Jordan Cove LNG export project denied by FERC. Late last week, FERC issued a ruling denying authorization for the Jordan Cove LNG export project on the Oregon coast, as well as the connecting pipeline, the Pacific Connector. FERC cited the lack of committed purchases on the Pacific Connector, and Jordan Cove’s dependence on the Pacific Connector for feedgas. As mentioned in the FERC docket, this project has faced significant opposition from local and environmental groups.
Storage:
Net withdrawals from storage are significantly below historical norms for this time of year. Net withdrawals from storage totaled 1 Bcf, compared with the five-year average withdrawal of 81 Bcf and the year-ago value of 88 Bcf for the week. This is the seventh week in a row that net withdrawals have fallen below the five-year average. Since January 22, the storage surplus relative to the five-year average has grown from 432 to 807 Bcf. Natural gas storage inventories are 998 Bcf higher than last year’s levels.
Working gas stocks are poised to end the heating season near record-high levels. If net withdrawals from storage follow the five-year average for the remainder of the heating season, working gas stocks will total 2,416 Bcf on March 31—the traditional end of the heating season. The previous high for the end of the heating season occurred in 2012, when working gas stocks totaled 2,473 on March 31, 2012. Working gas stocks totaled 2,372 Bcf at this time in 2012, before an early start to net injection activity raised working gas levels during the last weeks of the heating season.
Three regions reported net injections for the week. Although a net withdrawal was reported on a national level, this marks the second consecutive week of net injection activity in the Mountain, Pacific, and South Central regions. Net withdrawals from storage totaling 22 Bcf were reported in the East and Midwest regions, compared with net injections totaling 21 Bcf in the Mountain, Pacific, and South Central regions. Net injection activity was not reported for these regions at this time last year.
This week’s storage figure fell within the range of analyst expectations. Expectations for this week’s storage report called for a withdrawal of 4 Bcf, on average, with some analysts predicting net withdrawals of 19 Bcf, and others expecting net injections of up to 14 Bcf. Immediately following the release of the EIA Weekly Natural Gas Storage Report (WNGSR), the Nymex futures contract for April delivery at the Henry Hub fell by 2¢/MMBtu to $1.86/MMBtu.
Temperatures were higher than normal during the storage week. Temperatures in the Lower 48 states averaged 49.6°F during the report week, 18% higher than normal, and 21% above last year at this time. These above-normal temperatures are a continuation of an ongoing pattern that has occurred since the beginning of the 2015-16 heating season on November 1, 2015. Temperatures have been above normal levels during 16 out of 19 weeks in the 2015-16 heating season so far. Cumulative heating degree-days during this period are 15% below normal.
See also:

| Spot Prices ($/MMBtu) | Thu, 10-Mar |
Fri, 11-Mar |
Mon, 14-Mar |
Tue, 15-Mar |
Wed, 16-Mar |
|---|---|---|---|---|---|
| Henry Hub |
1.70 |
1.72 |
1.68 |
1.78 |
1.74 |
| New York |
1.02 |
0.88 |
1.12 |
1.17 |
1.18 |
| Chicago |
1.77 |
1.78 |
1.77 |
1.87 |
1.87 |
| Cal. Comp. Avg,* |
1.66 |
1.67 |
1.71 |
1.76 |
1.71 |
| Futures ($/MMBtu) | |||||
| April contract |
1.788 |
1.822 |
1.819 |
1.851 |
1.868 |
| May contract |
1.883 |
1.915 |
1.914 |
1.945 |
1.955 |
| *Avg. of NGI's reported prices for: Malin, PG&E citygate, and Southern California Border Avg. | |||||
| Source: NGI's Daily Gas Price Index | |||||
| U.S. natural gas supply - Gas Week: (3/9/16 - 3/16/16) | ||
|---|---|---|
Percent change for week compared with: |
||
last year |
last week |
|
| Gross production | -0.06%
|
-1.45%
|
| Dry production | -0.06%
|
-1.44%
|
| Canadian imports | -17.09%
|
-7.47%
|
| West (net) | 3.76%
|
2.67%
|
| Midwest (net) | 21.76%
|
19.33%
|
| Northeast (net) | -148.48%
|
-260.61%
|
| LNG imports | -8.57%
|
-36.70%
|
| Total supply | -1.22%
|
-1.93%
|
| Source: BENTEK Energy LLC | ||
| U.S. consumption - Gas Week: (3/9/16 - 3/16/16) | ||
|---|---|---|
Percent change for week compared with: |
||
last year |
last week |
|
| U.S. consumption | -2.9%
|
-11.3%
|
| Power | 10.5%
|
-2.1%
|
| Industrial | -1.3%
|
-3.5%
|
| Residential/commercial | -17.3%
|
-26.0%
|
| Total demand | -1.2%
|
-10.7%
|
| Source: BENTEK Energy LLC | ||
| Rigs | |||
|---|---|---|---|
Fri, March 11, 2016 |
Change from |
||
last week |
last year |
||
| Oil rigs | 386 |
-1.53% |
-55.43% |
| Natural gas rigs | 94 |
-3.09% |
-63.42% |
| Miscellaneous | 0 |
0.00% |
-100.00% |
| Rig numbers by type | |||
|---|---|---|---|
Fri, March 11, 2016 |
Change from |
||
last week |
last year |
||
| Vertical | 55 |
-5.17% |
-66.87% |
| Horizontal | 375 |
-3.60% |
-55.83% |
| Directional | 50 |
19.05% |
-54.55% |
| Source: Baker Hughes Inc. | |||
| Working gas in underground storage | ||||
|---|---|---|---|---|
Stocks billion cubic feet (bcf) |
||||
| Region | 2016-03-11 |
2016-03-04 |
change |
|
| East | 452 |
464 |
-12 |
|
| Midwest | 577 |
587 |
-10 |
|
| Mountain | 147 |
146 |
1 |
|
| Pacific | 259 |
258 |
1 |
|
| South Central | 1,043 |
1,024 |
19 |
|
| Total | 2,478 |
2,479 |
-1 |
|
| Source: U.S. Energy Information Administration | ||||
| Working gas in underground storage | |||||
|---|---|---|---|---|---|
Historical comparisons |
|||||
Year ago (3/11/15) |
5-year average (2011-2015) |
||||
| Region | Stocks (Bcf) |
% change |
Stocks (Bcf) |
% change |
|
| East | 295 |
53.2 |
337 |
34.1 |
|
| Midwest | 290 |
99.0 |
370 |
55.9 |
|
| Mountain | 111 |
32.4 |
117 |
25.6 |
|
| Pacific | 261 |
-0.8 |
200 |
29.5 |
|
| South Central | 524 |
99.0 |
647 |
61.2 |
|
| Total | 1,480 |
67.4 |
1,671 |
48.3 |
|
| Source: U.S. Energy Information Administration | |||||
| Temperature -- heating & cooling degree days (week ending Mar 10) | ||||||||
|---|---|---|---|---|---|---|---|---|
HDD deviation from: |
CDD deviation from: |
|||||||
| Region | HDD Current |
normal |
last year |
CDD Current |
normal |
last year |
||
| New England | 181
|
-39
|
-72
|
0
|
0
|
0
|
||
| Middle Atlantic | 147
|
-60
|
-91
|
0
|
0
|
0
|
||
| E N Central | 143
|
-76
|
-107
|
0
|
-1
|
0
|
||
| W N Central | 128
|
-91
|
-71
|
0
|
-1
|
0
|
||
| South Atlantic | 92
|
-34
|
-39
|
11
|
1
|
-5
|
||
| E S Central | 78
|
-43
|
-76
|
3
|
-1
|
3
|
||
| W S Central | 33
|
-42
|
-88
|
14
|
5
|
14
|
||
| Mountain | 122
|
-48
|
-25
|
2
|
1
|
1
|
||
| Pacific | 83
|
-11
|
32
|
0
|
-1
|
0
|
||
| United States | 112
|
-51
|
-60
|
4
|
1
|
1
|
||
|
Note: HDD = heating degree-day; CDD = cooling degree-day Source: National Oceanic and Atmospheric Administration | ||||||||
Average temperature (°F)
7-Day Mean ending Mar 10, 2016
Source: NOAA/National Weather Service
Deviation between average and normal (°F)
7-Day Mean ending Mar 10, 2016
Source: NOAA/National Weather Service